Lecture 5 Energy Systems and Energy Conversion Technologies
February 24, 2025
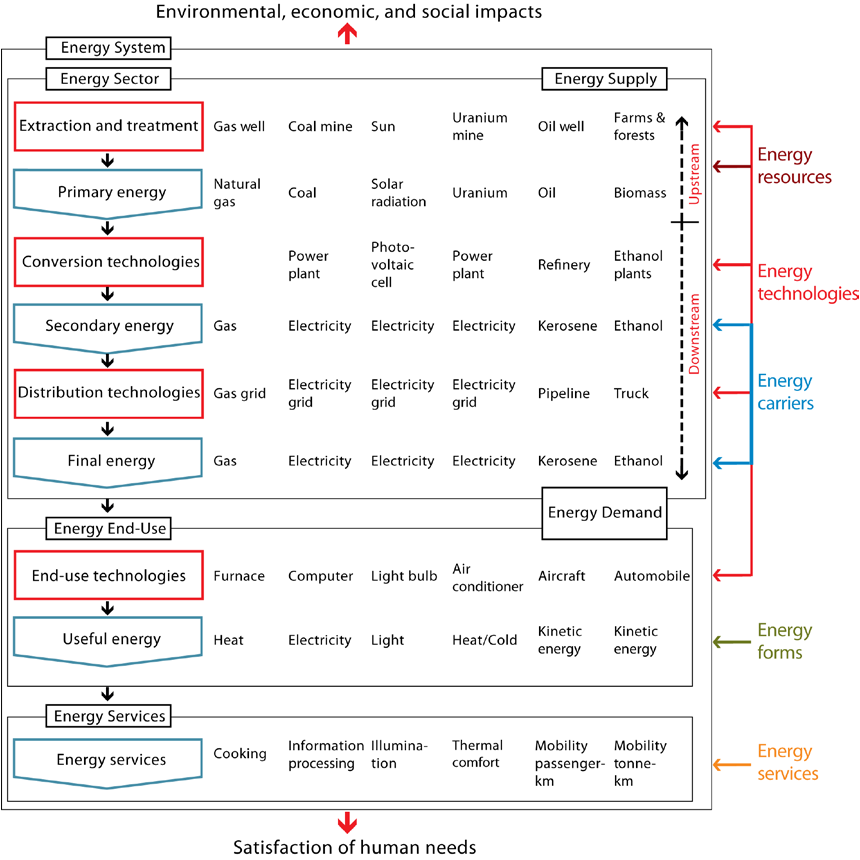
Energy systems
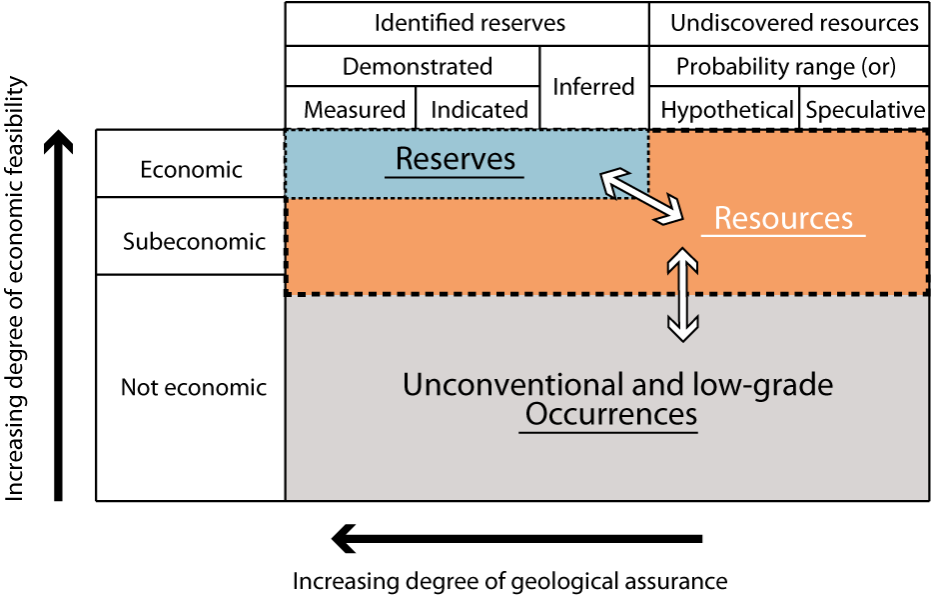
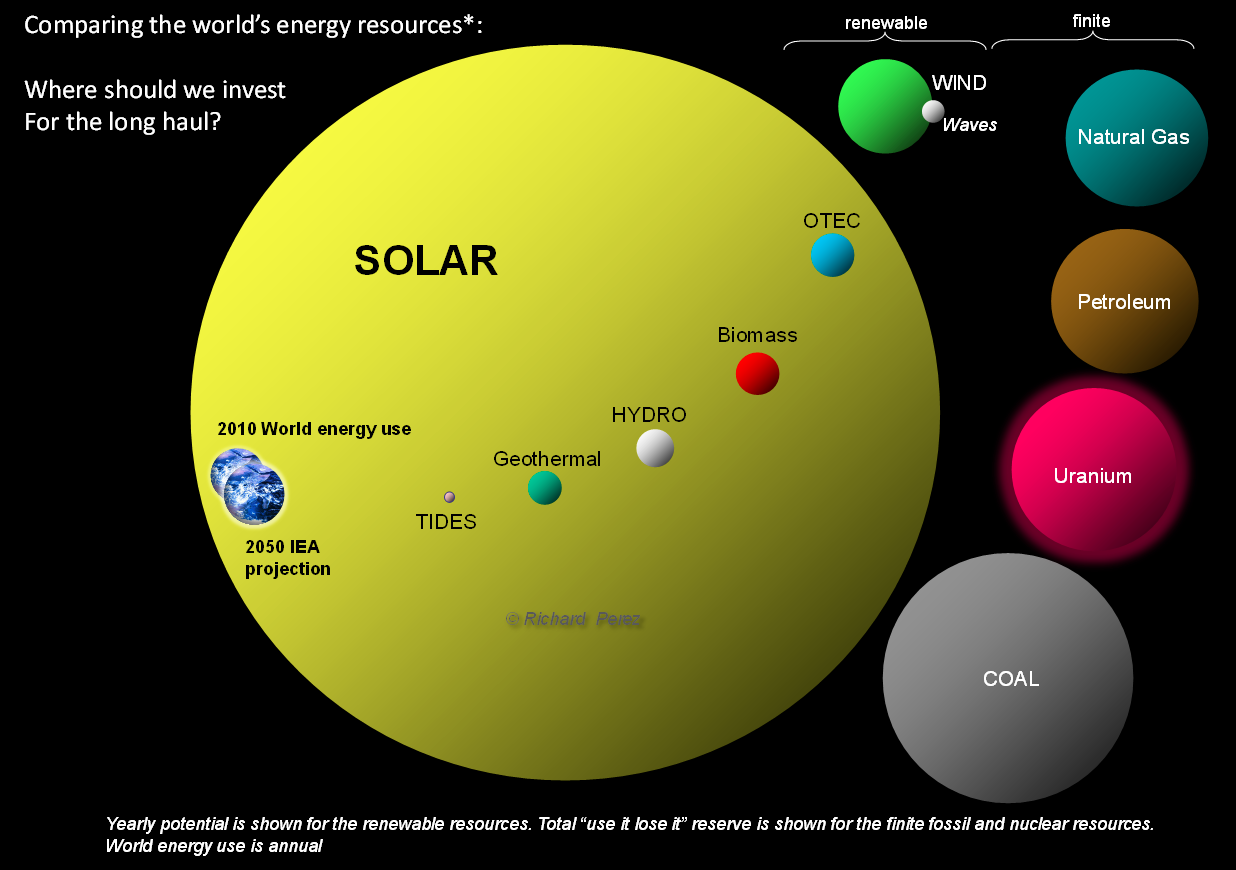
Resources vs reserves
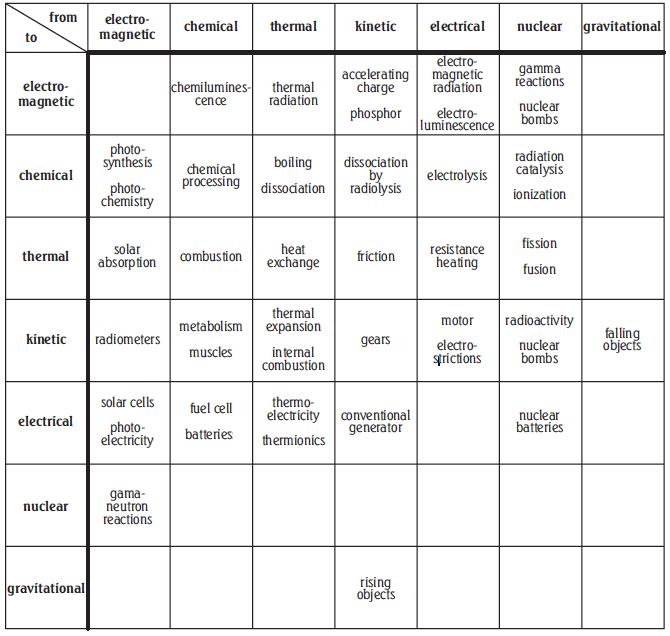
Energy and their conversions
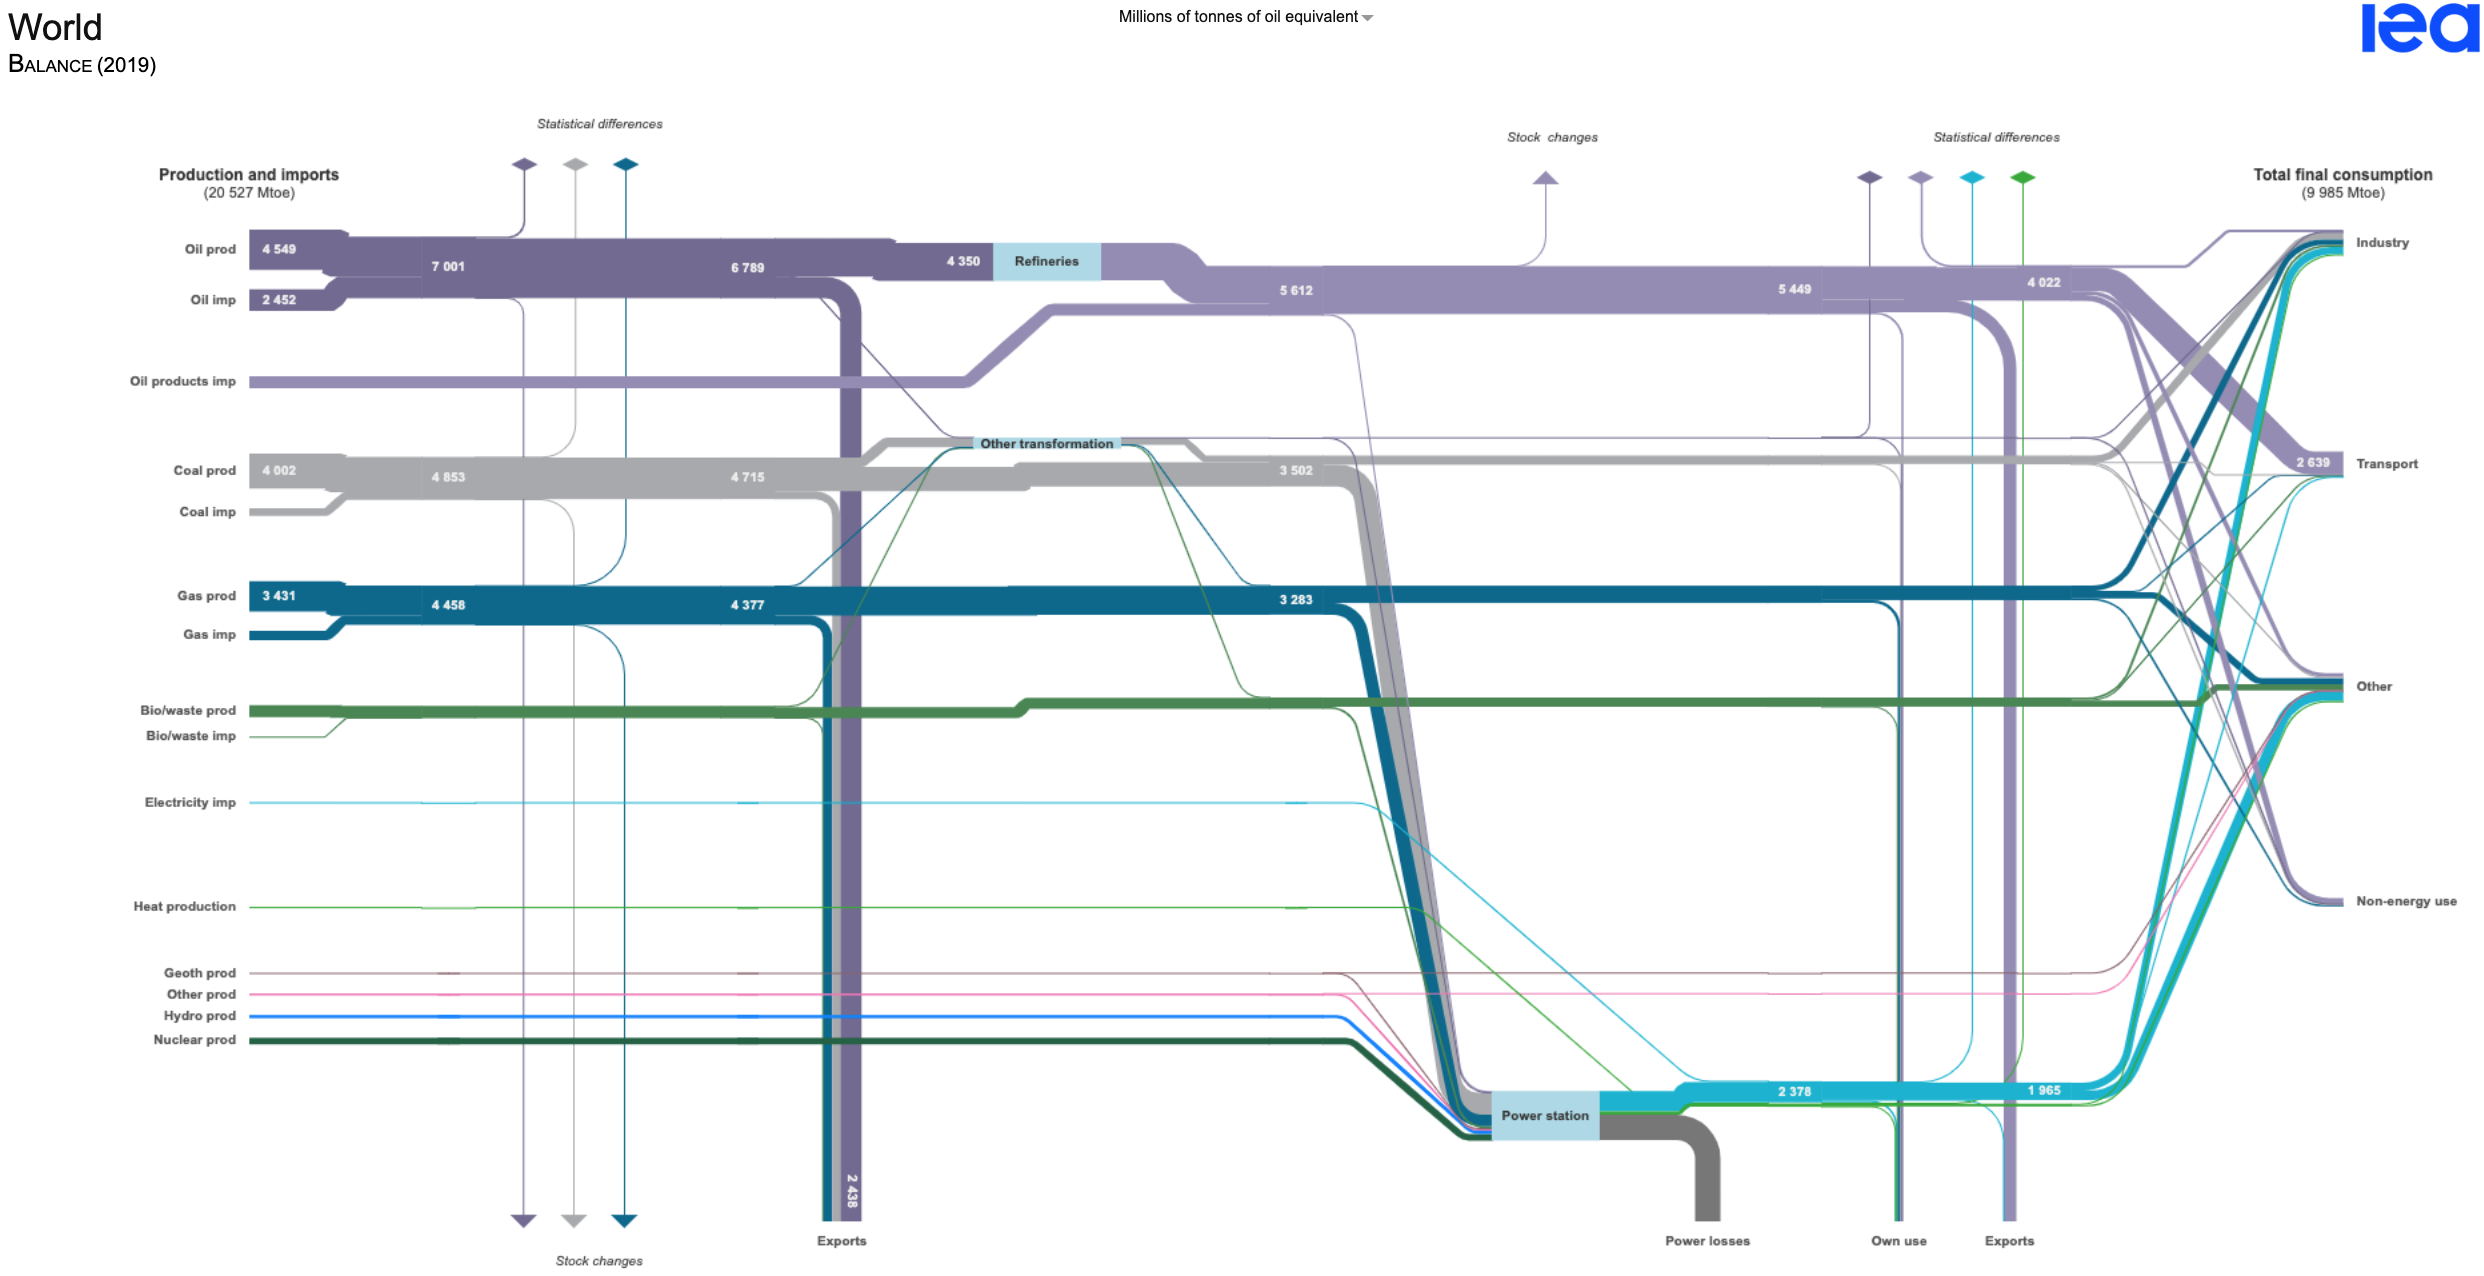
Global energy flow
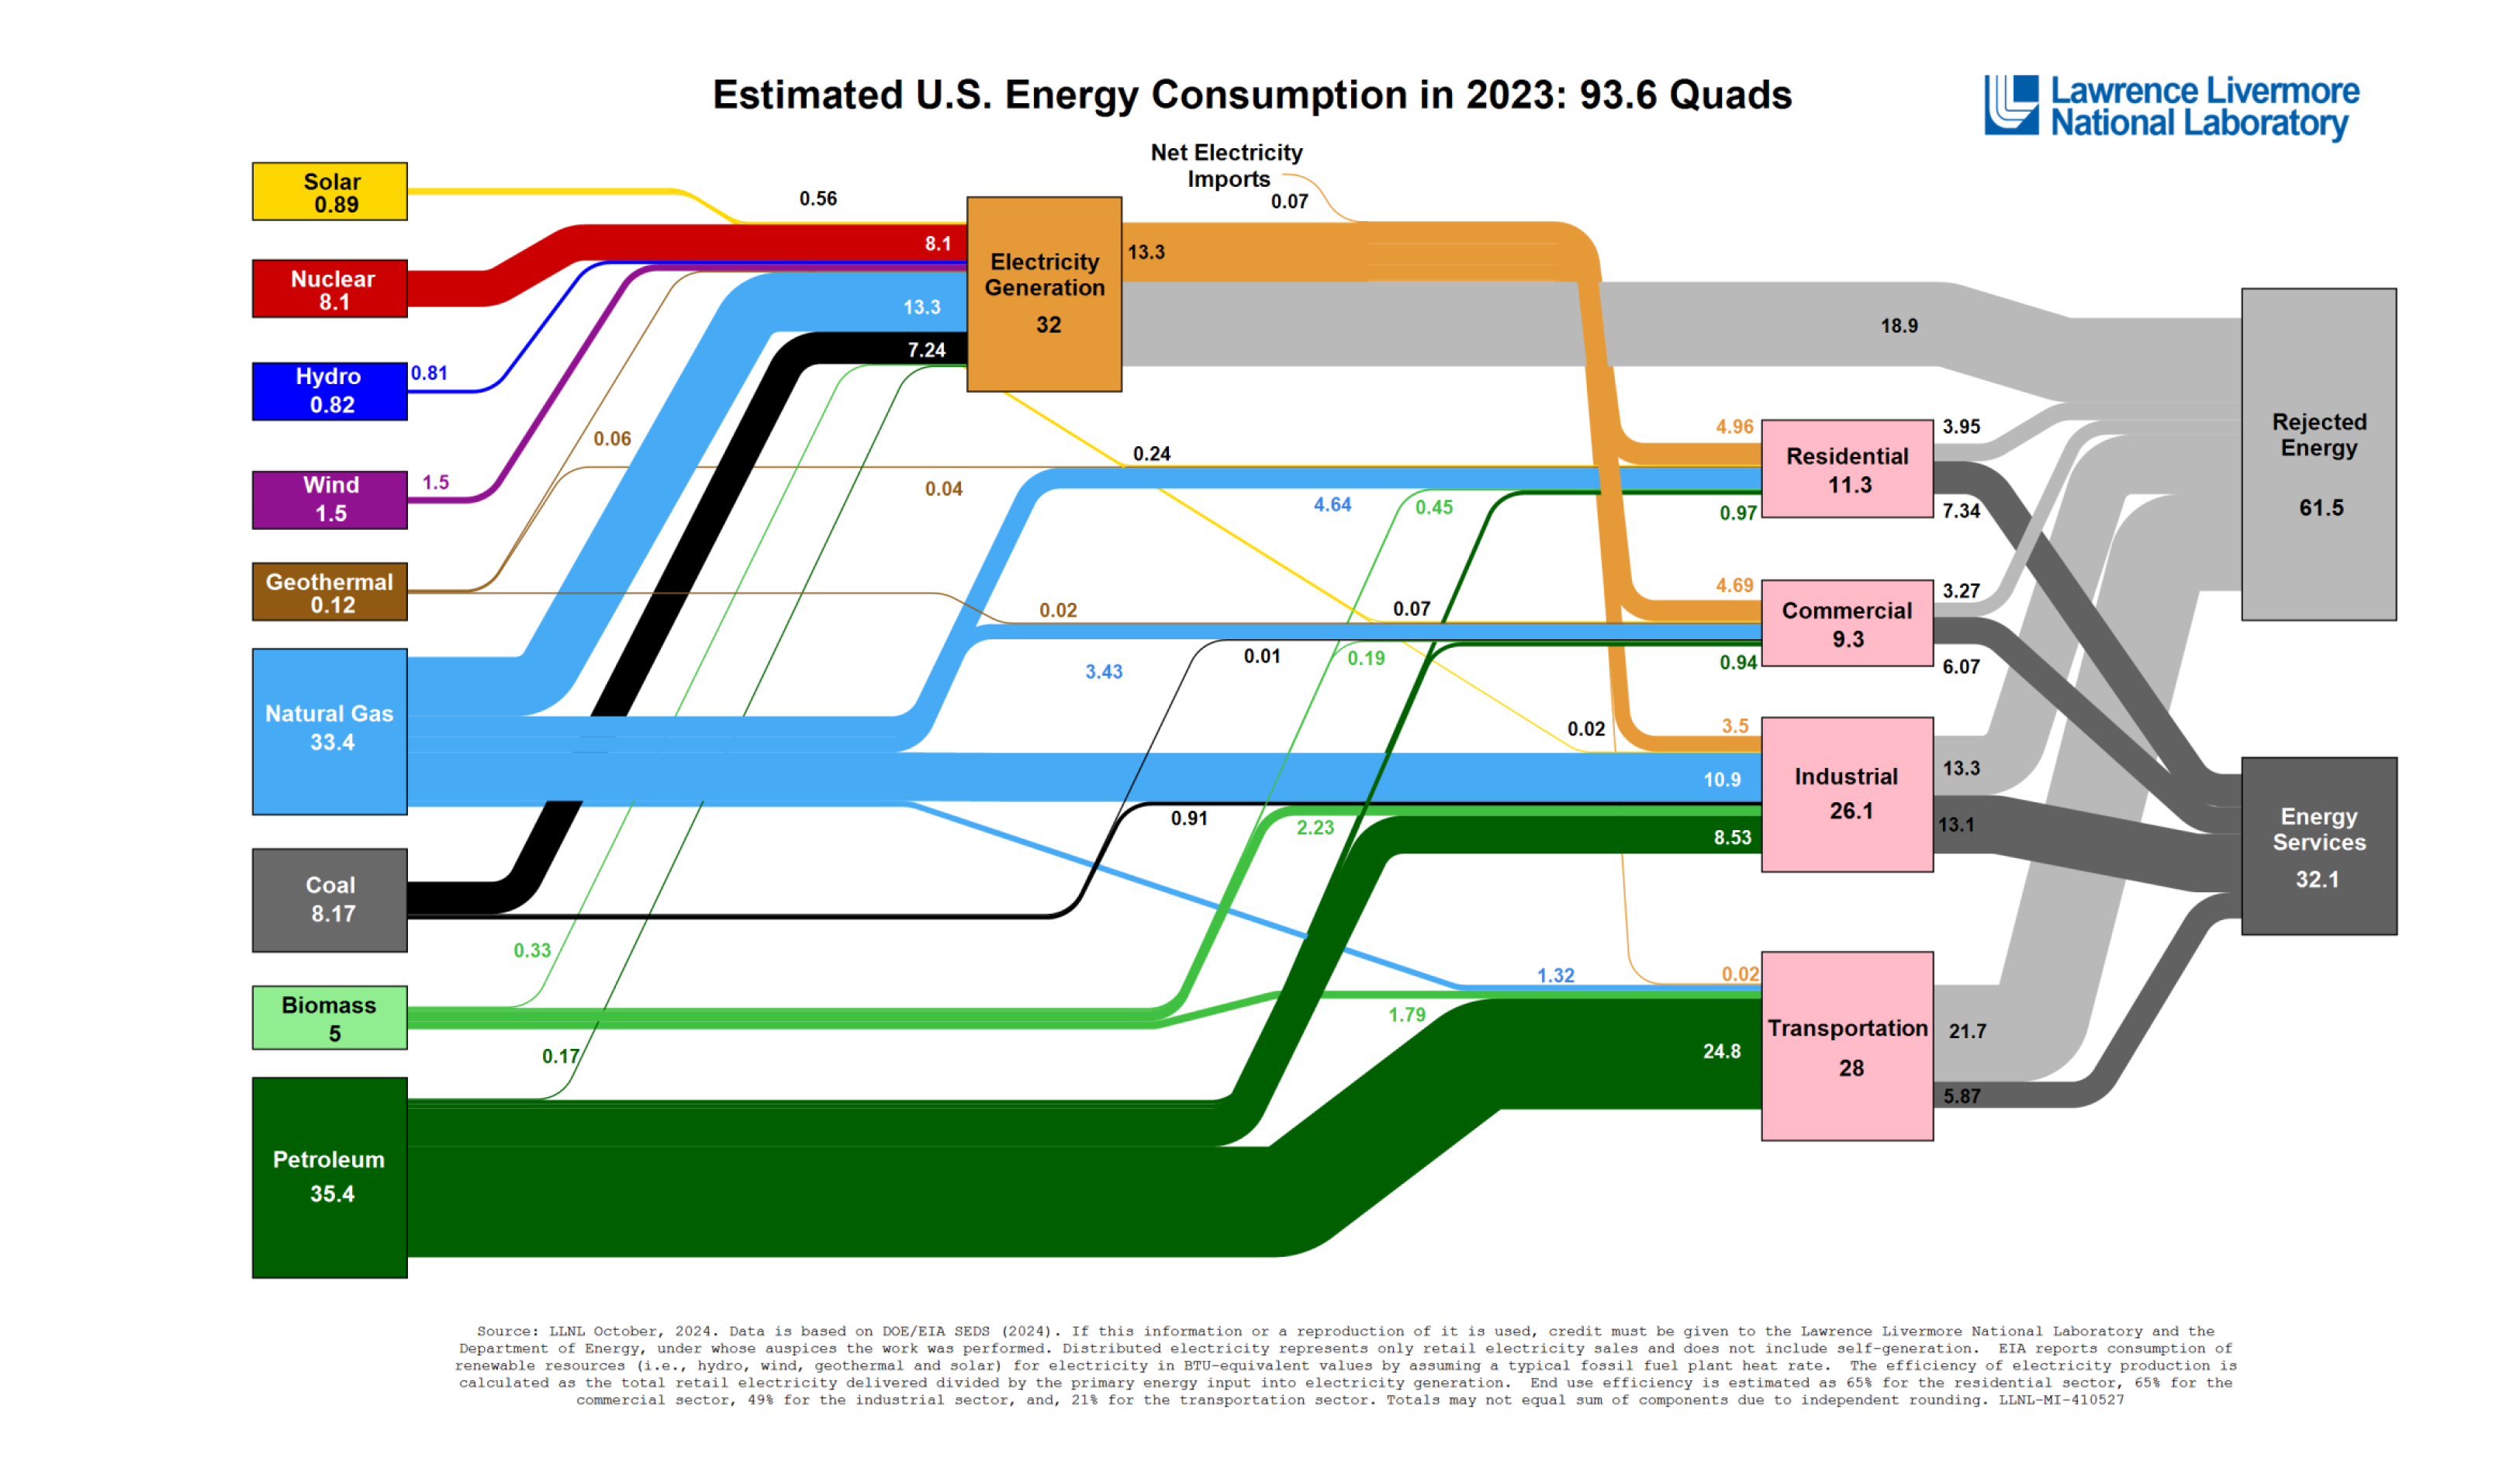
U.S. energy flow
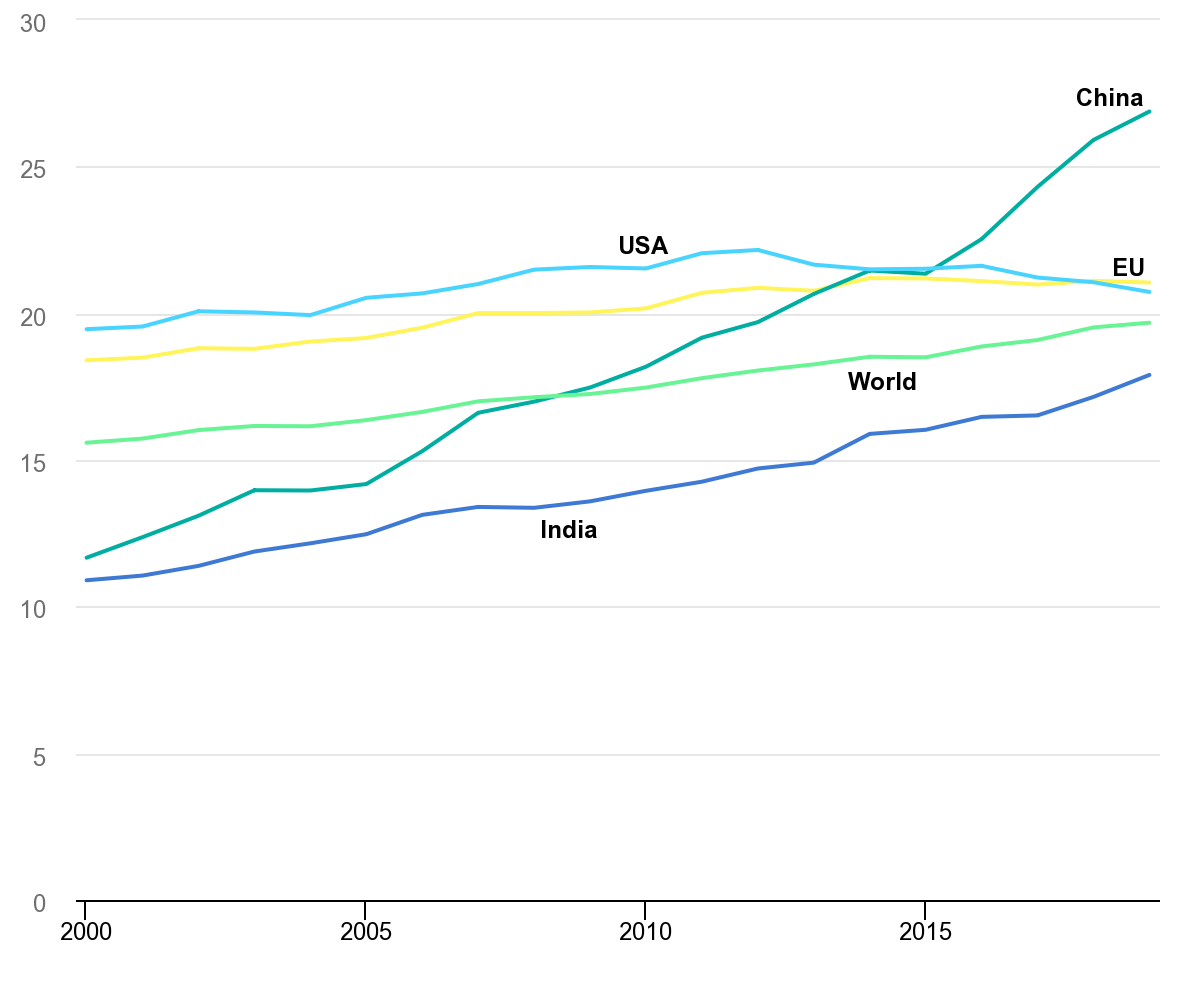
Energy by supply

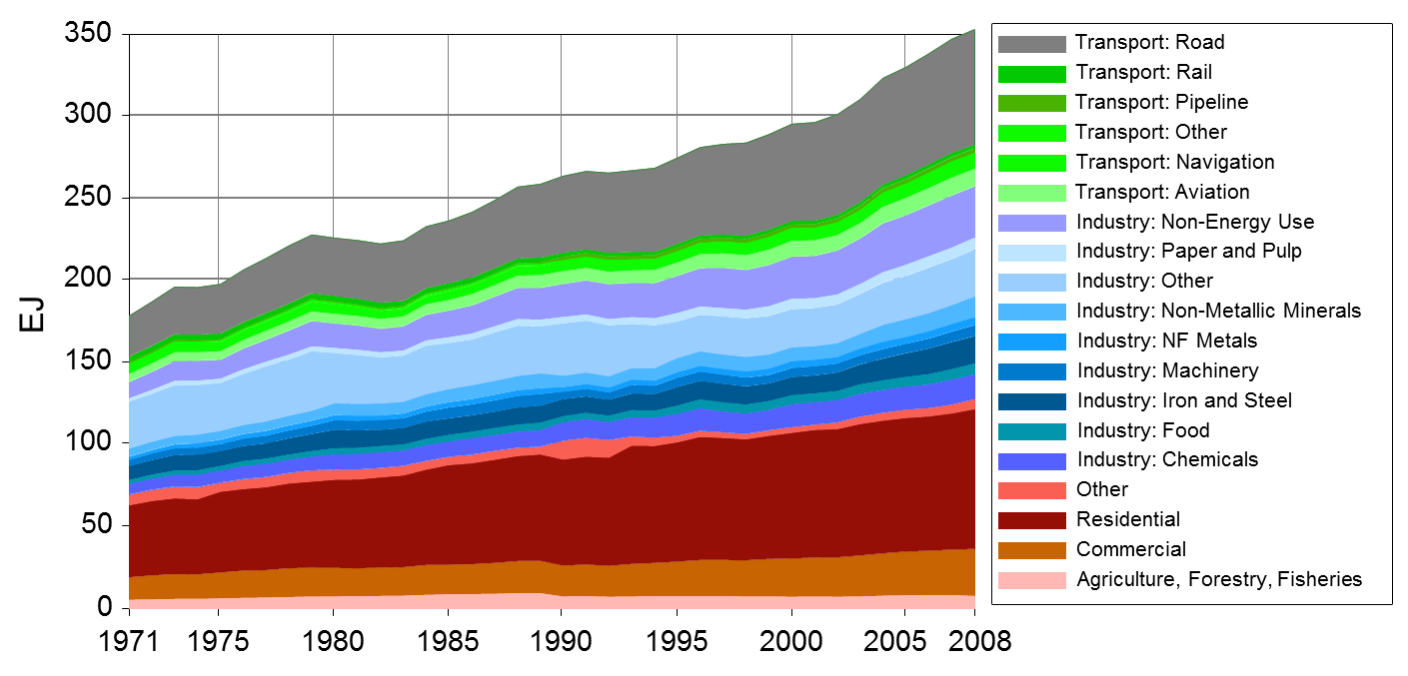
Energy end-use by sector
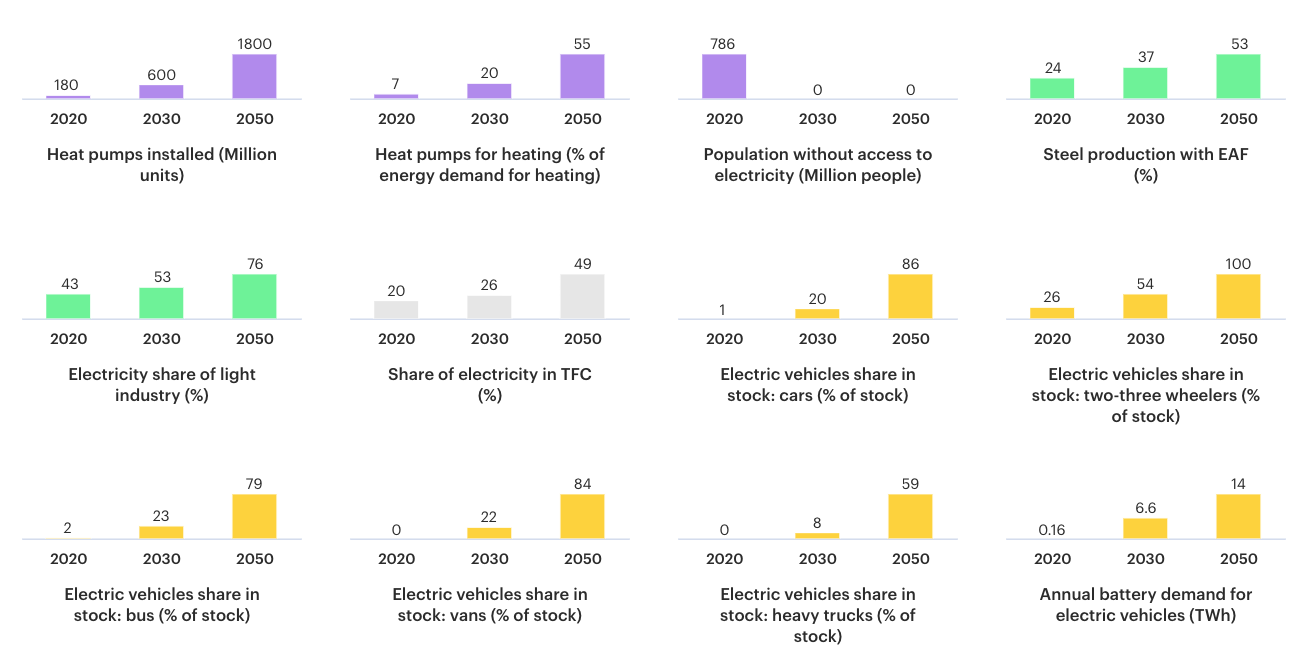
Electrify eveything, where are we now
Electrify eveything, net zero

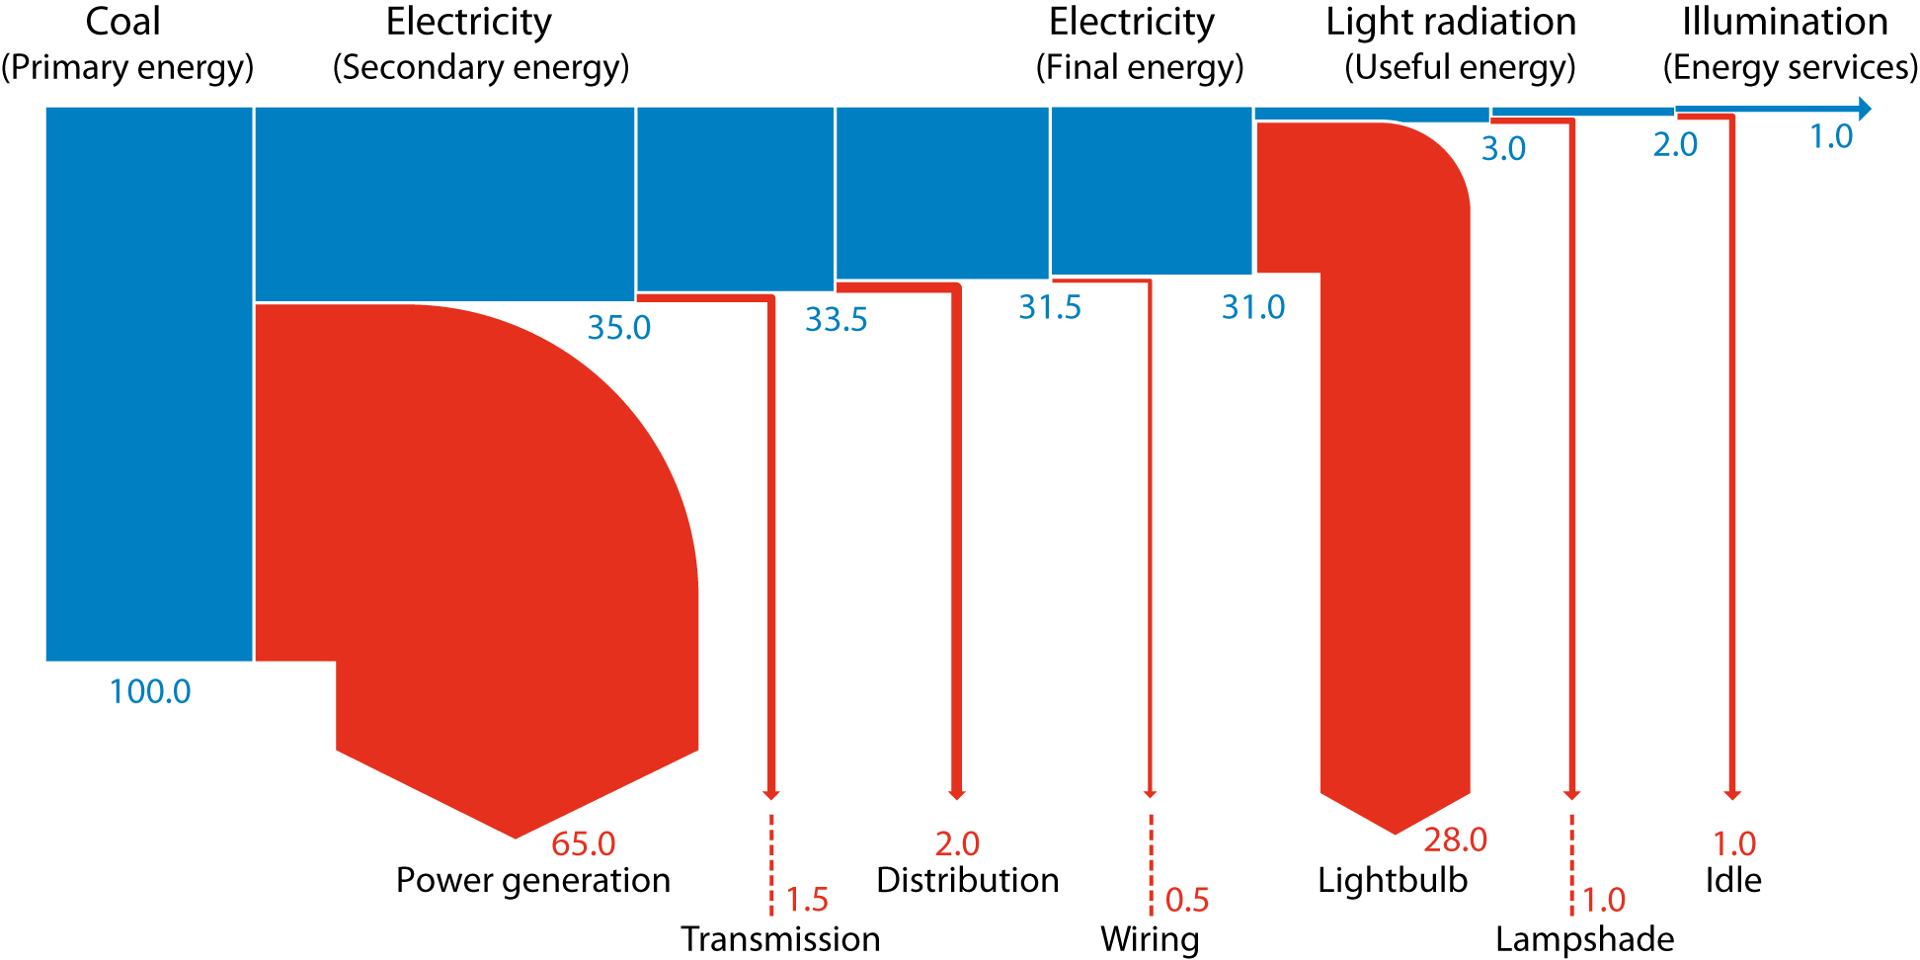
Energy efficiency
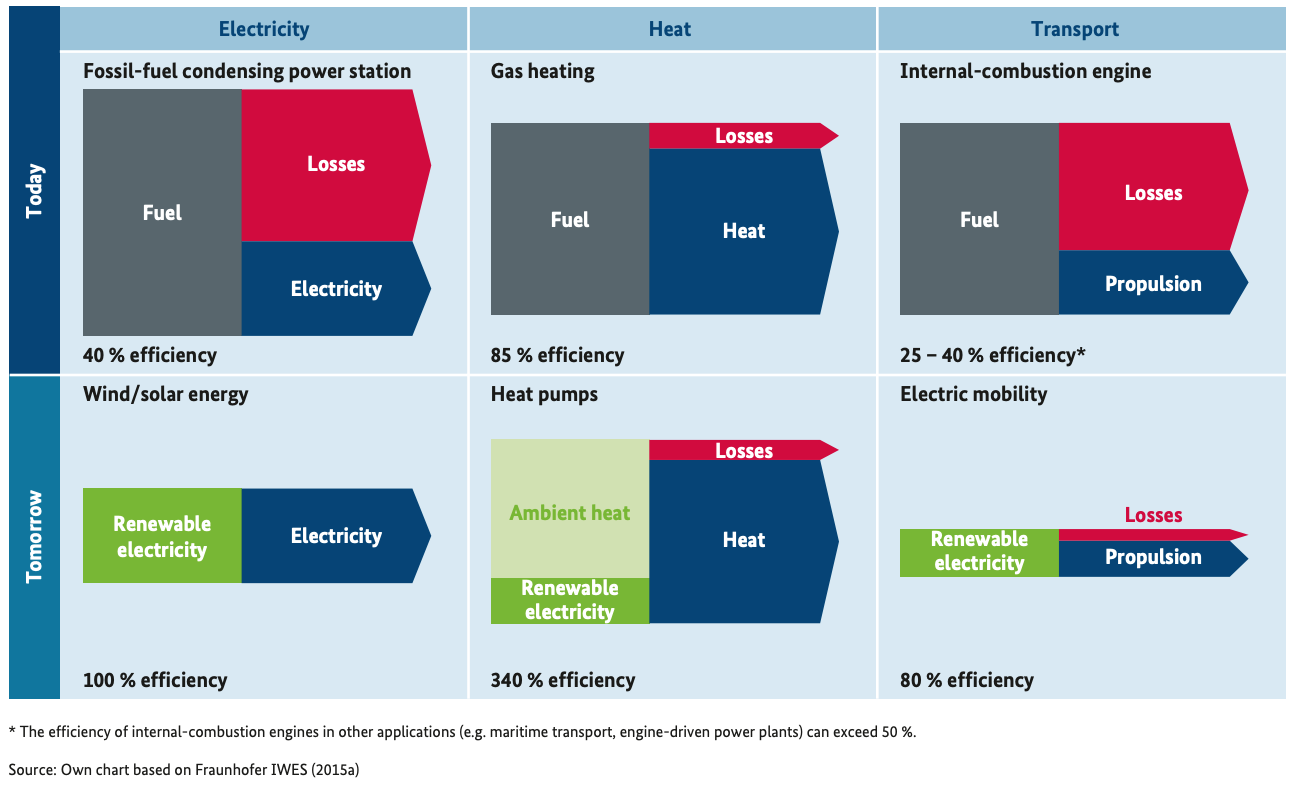
Electric efficiency vs fossil efficiency
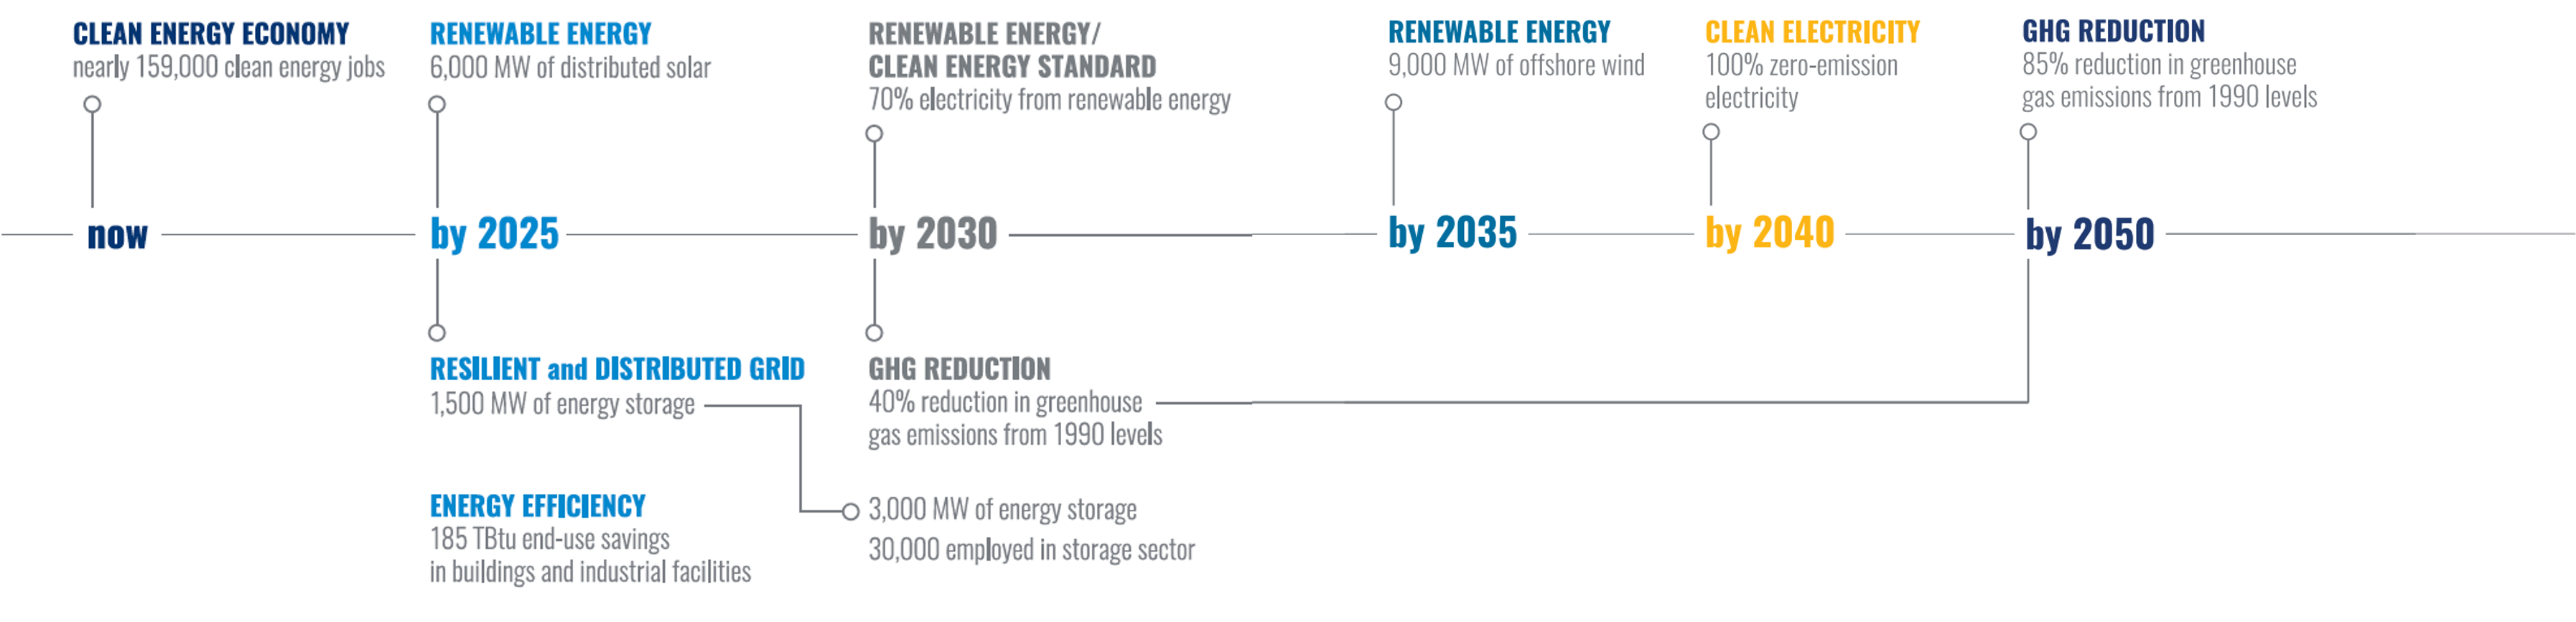
Milestones for long-term energy transition
NYS Climate Leadership and Community Protection Act
35%-40% of the benefits of NY CLCPA investments must flow to disadvantaged communities
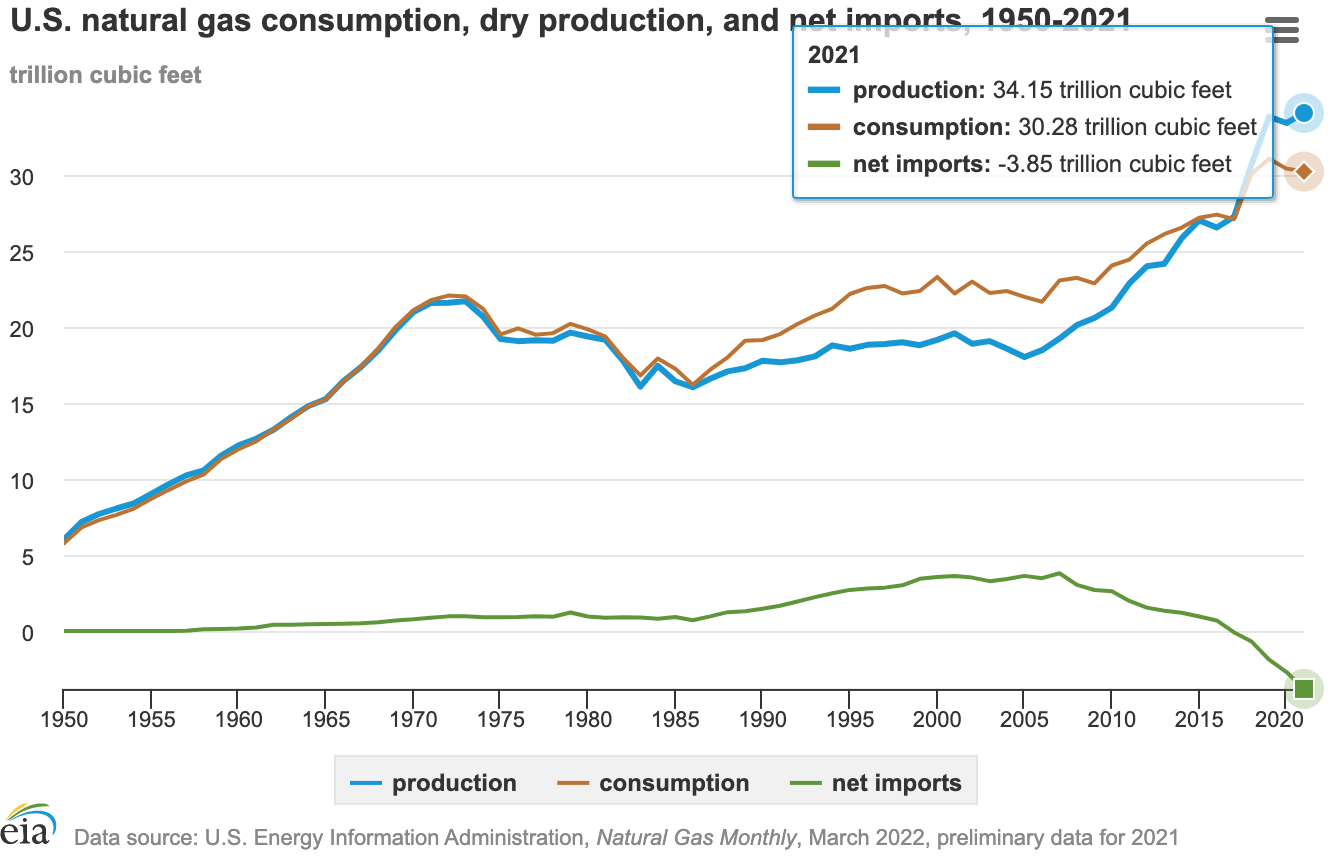
U.S. shale gas revolution
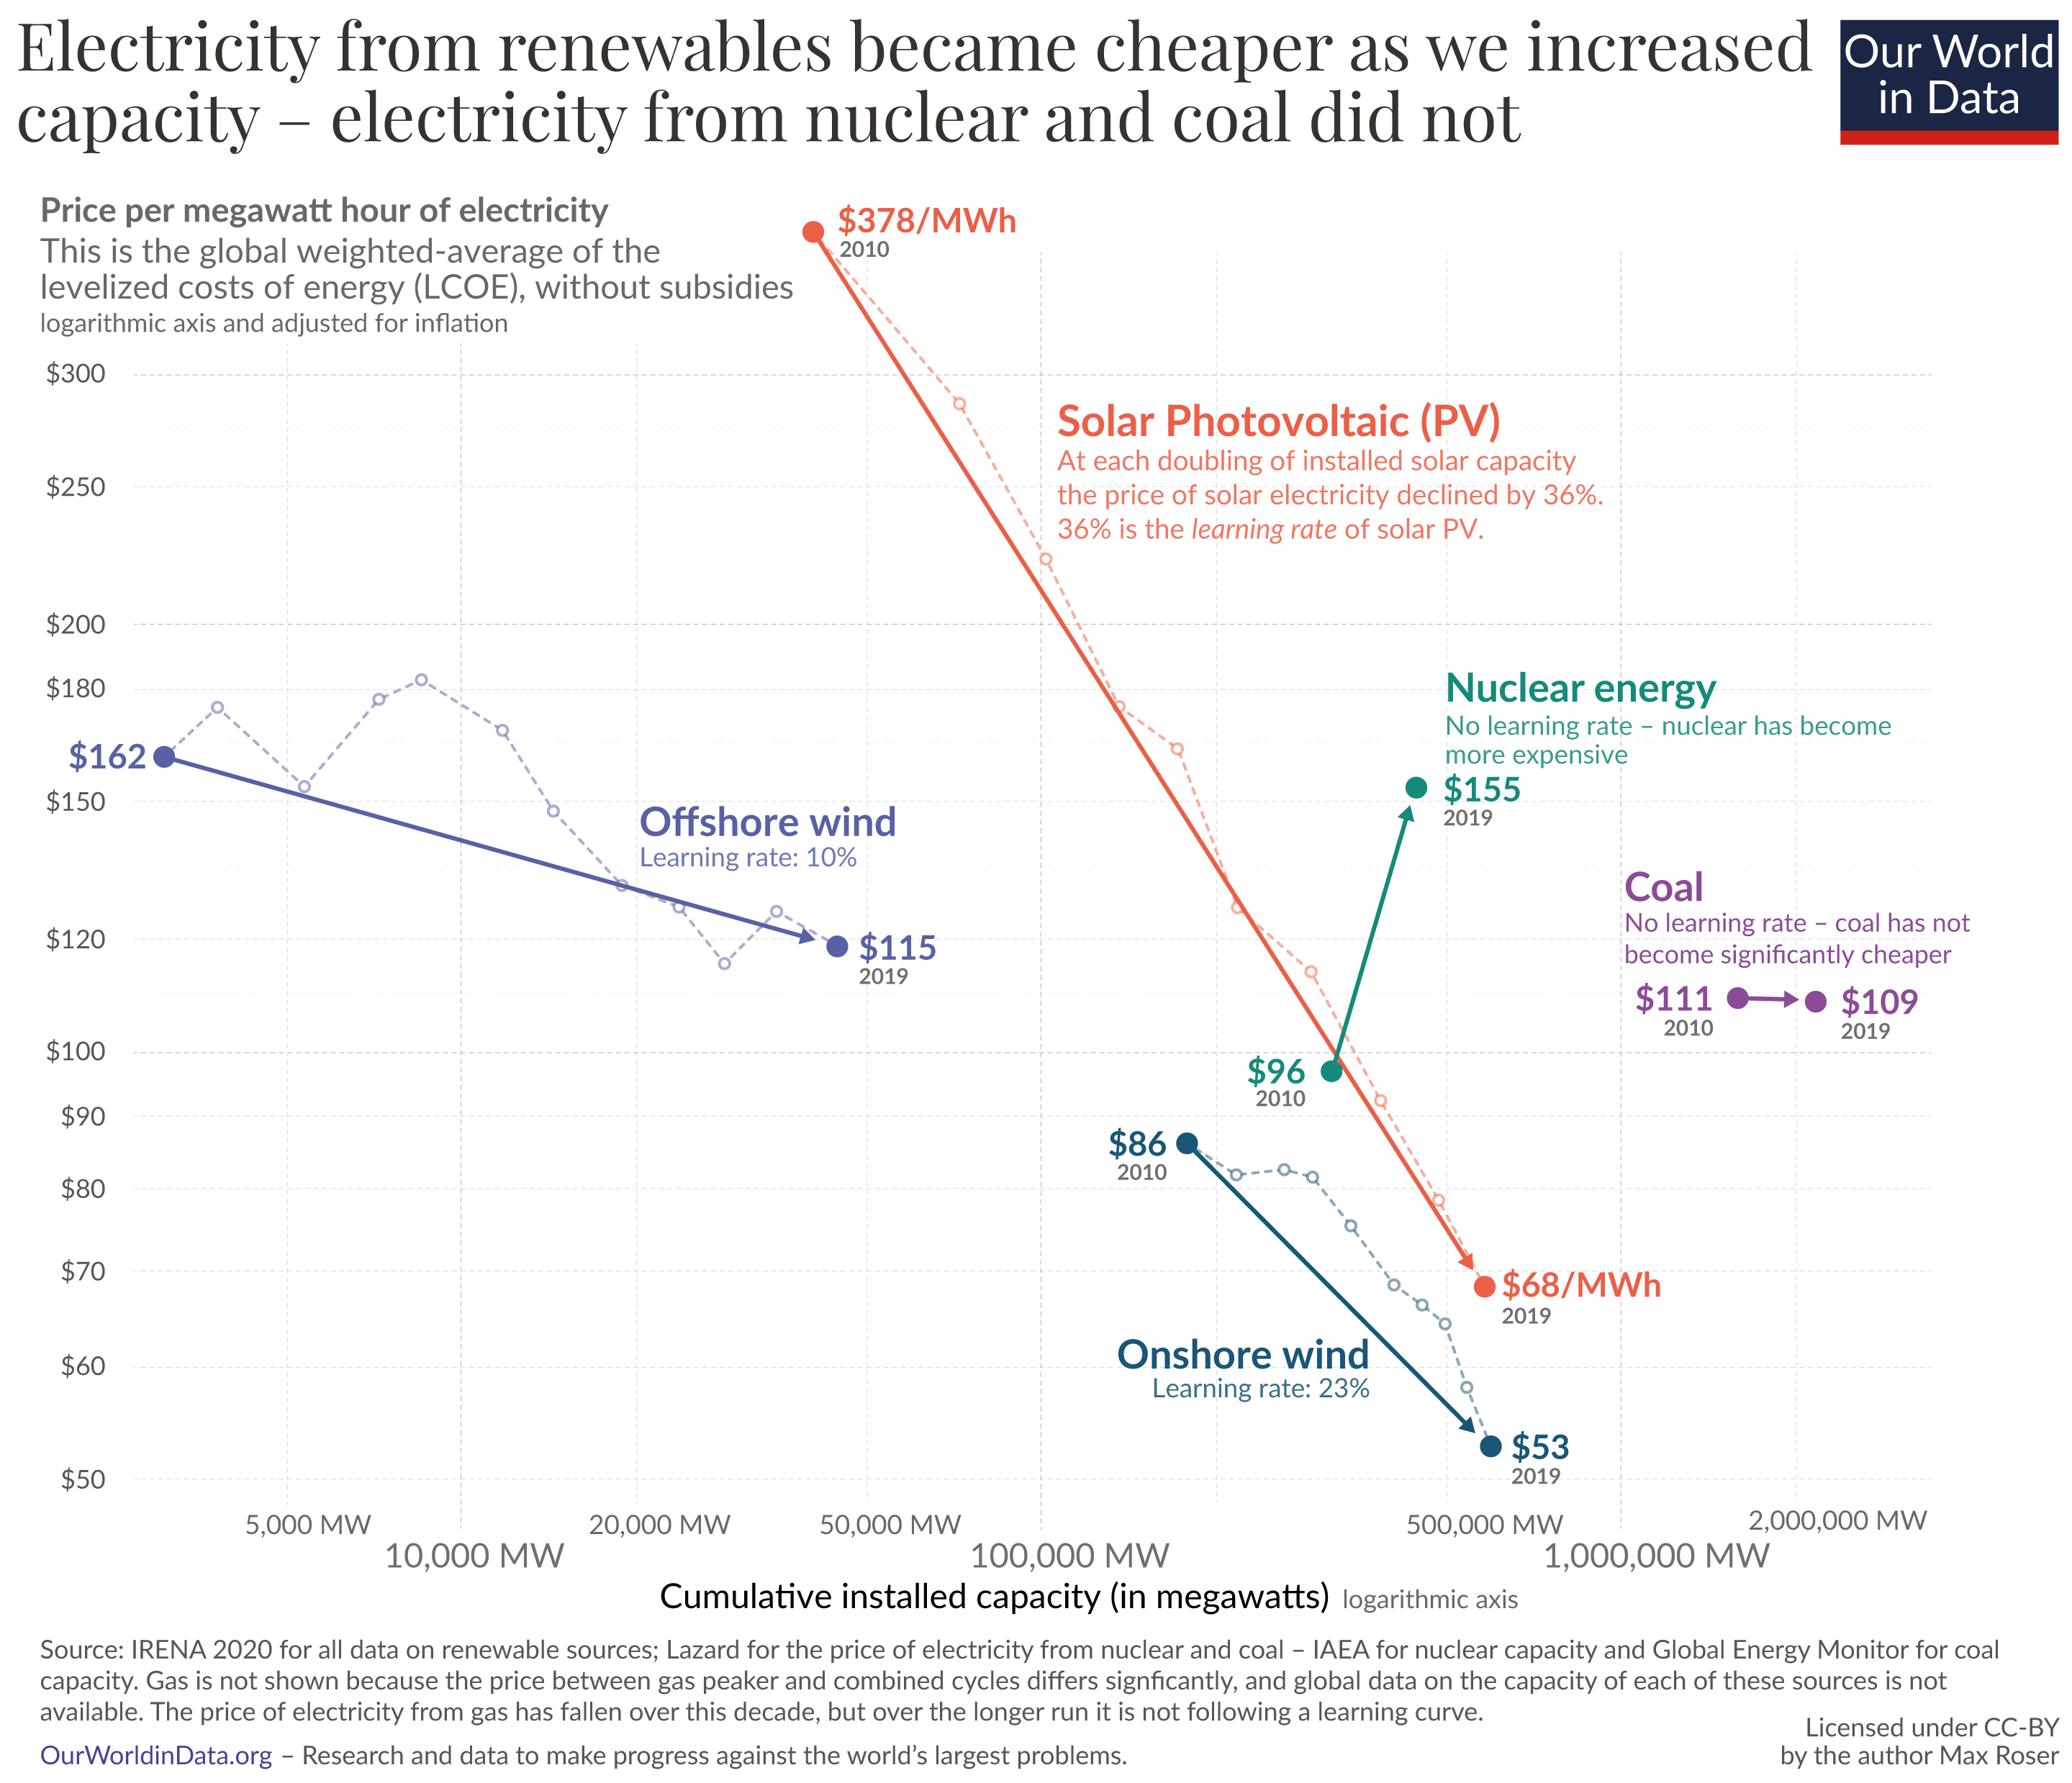
Renewable revolution: achieving grid parity
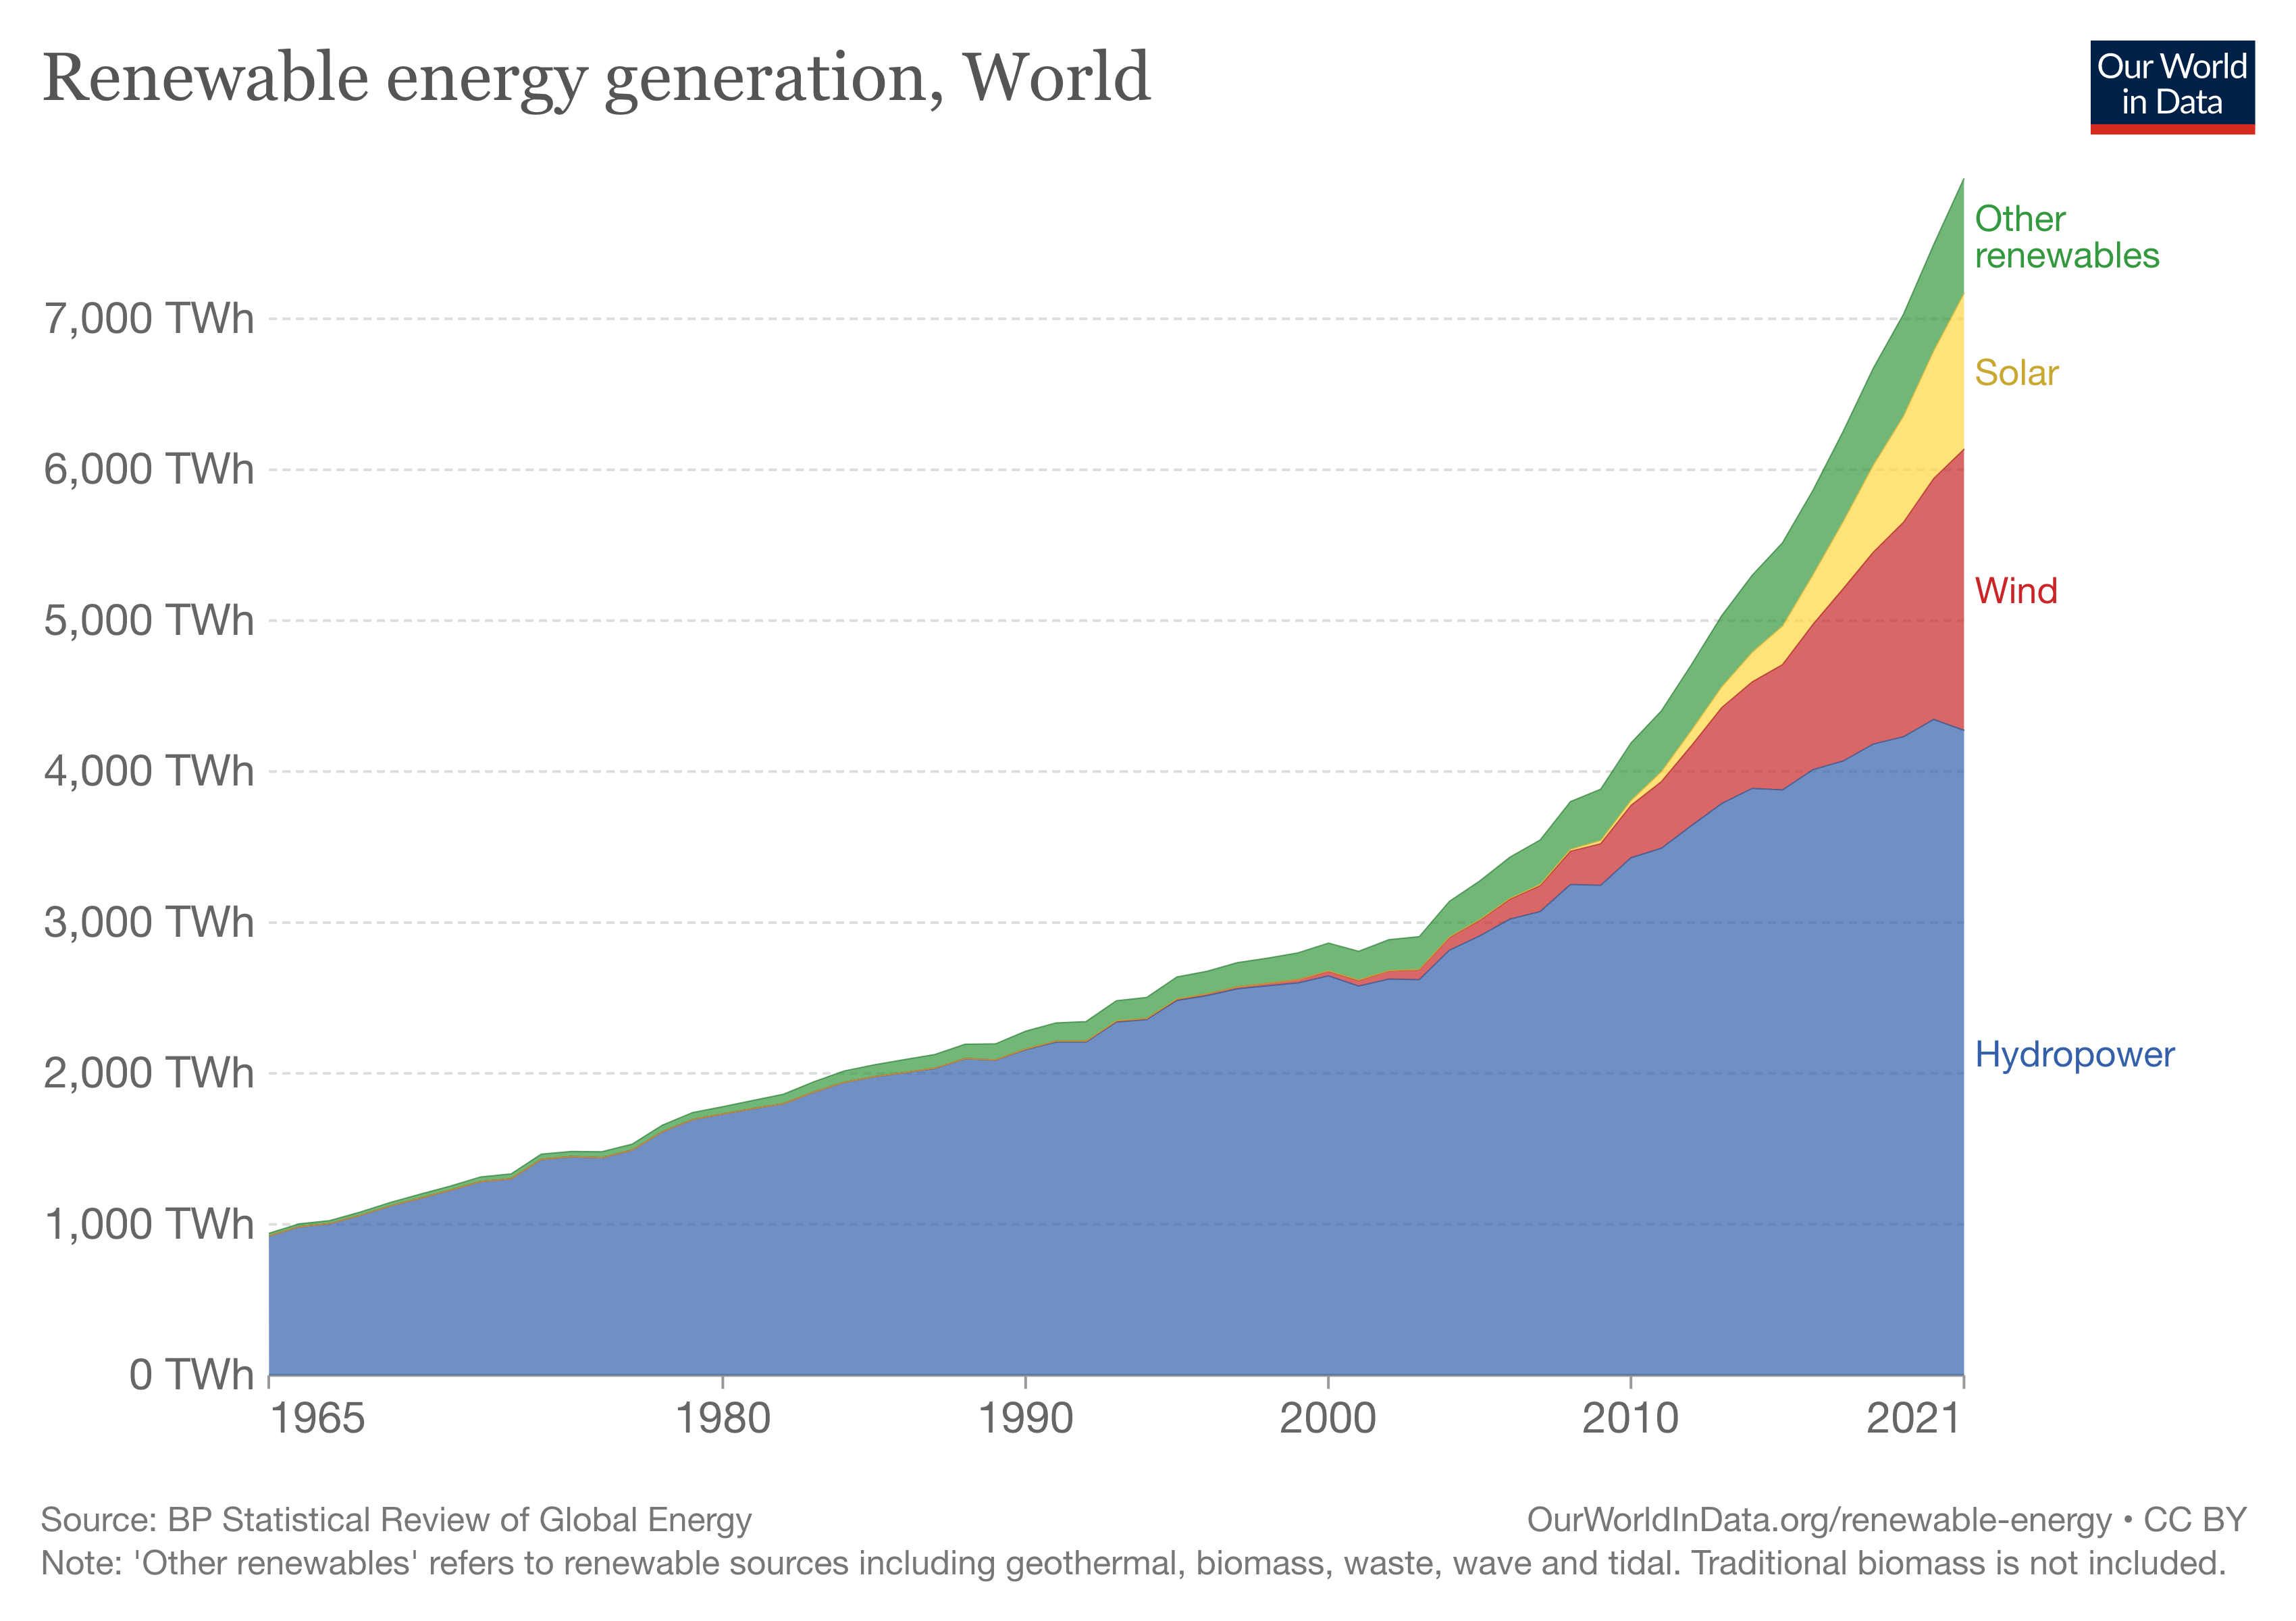
Renewable revolution: solar and wind taking off
Heat engine
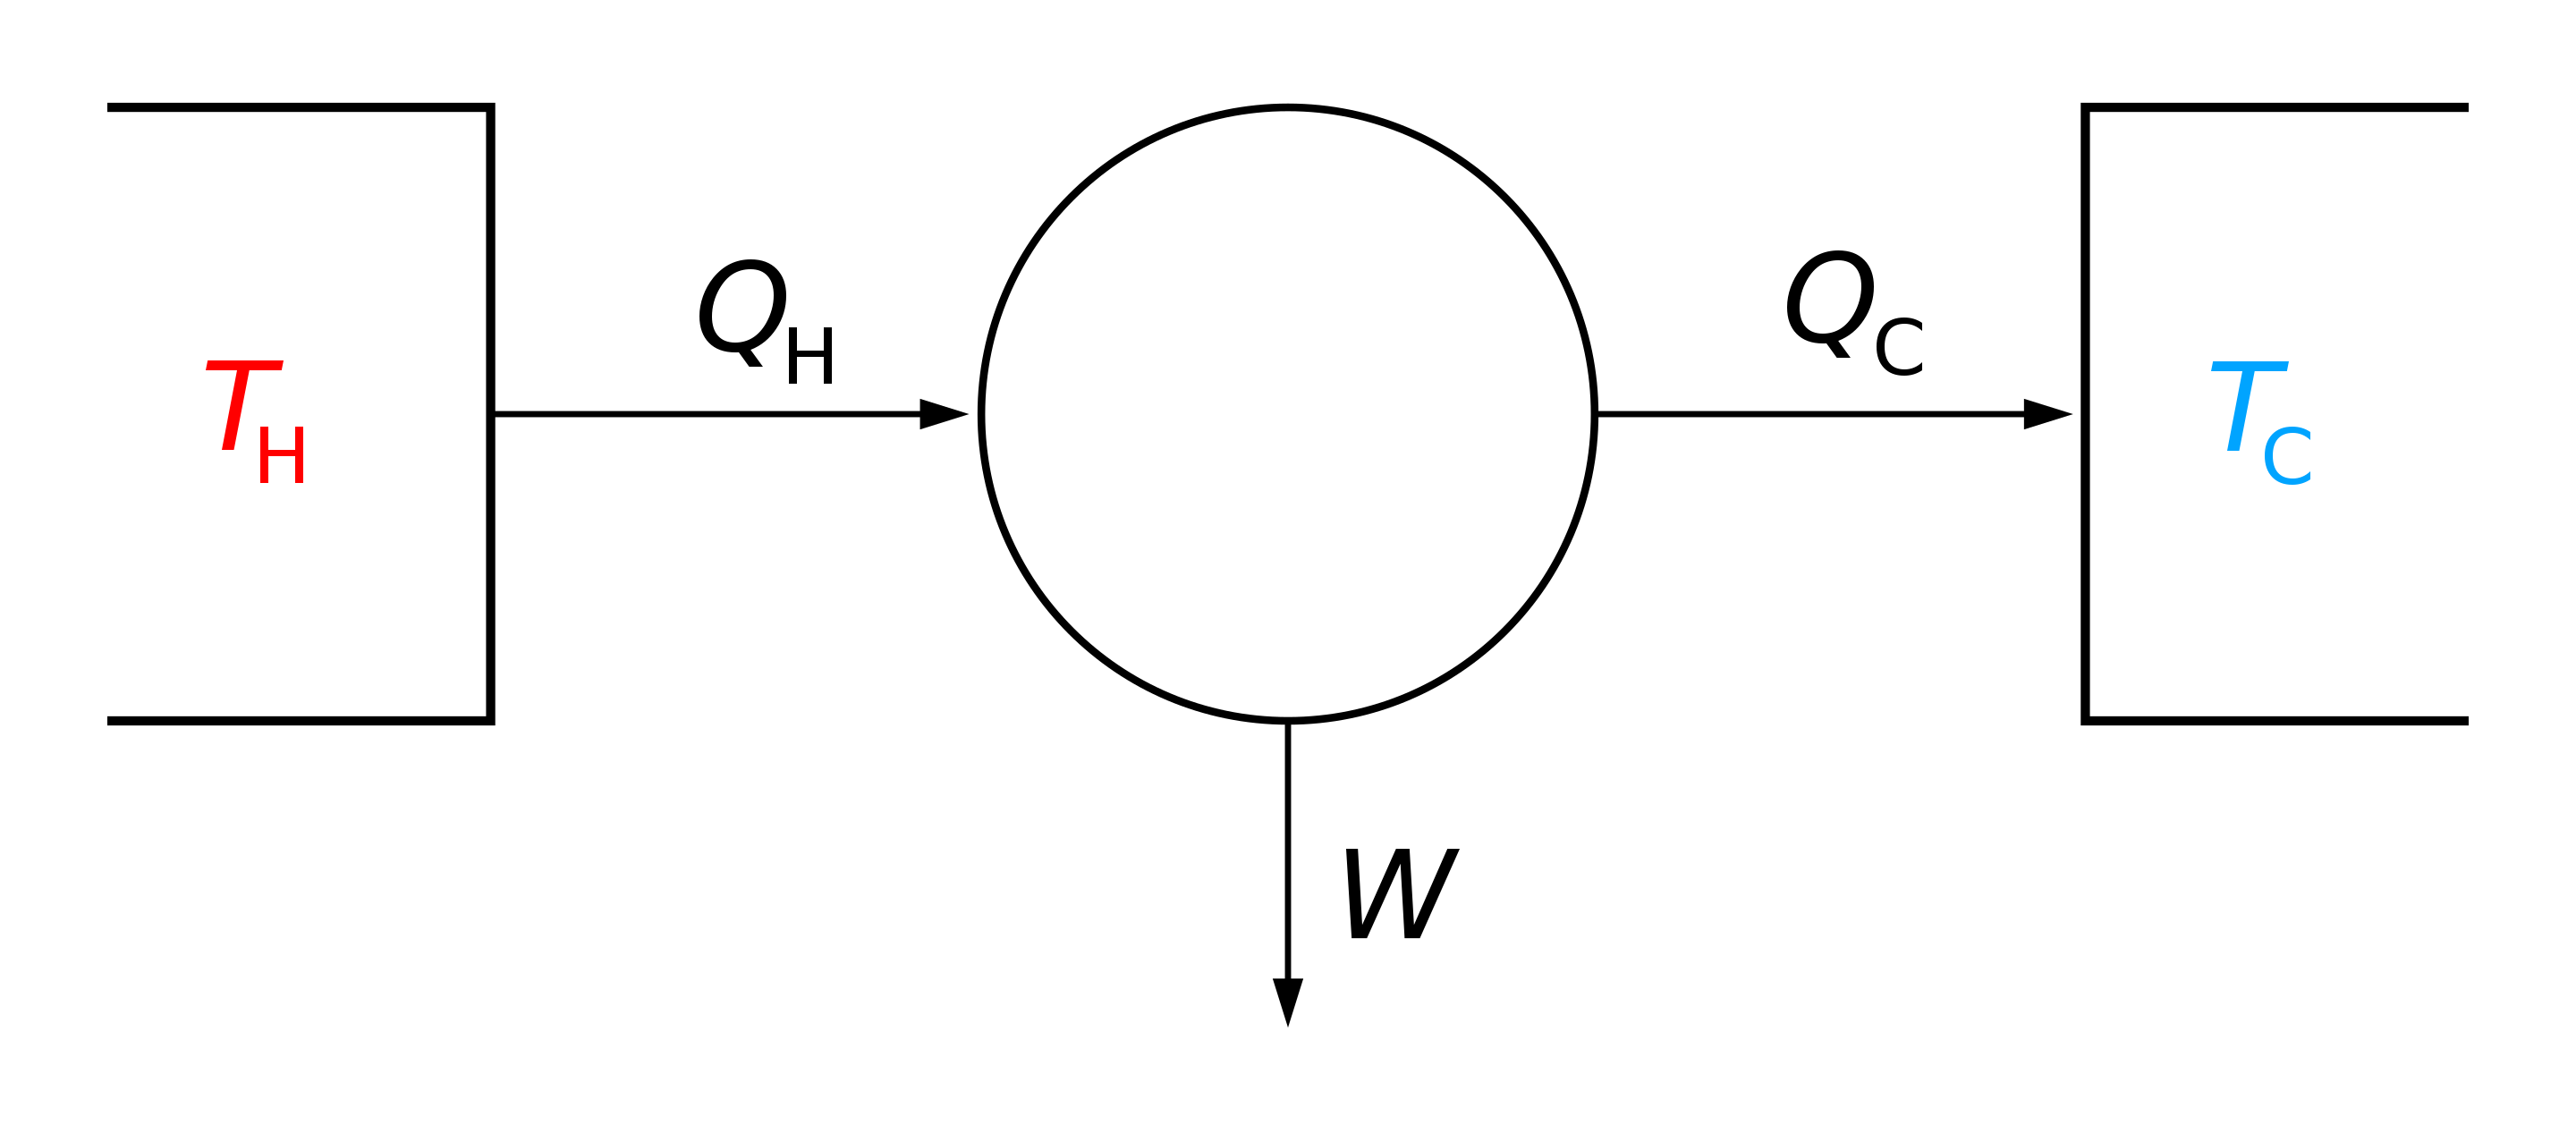
Heat -> Mechanical energy (work)
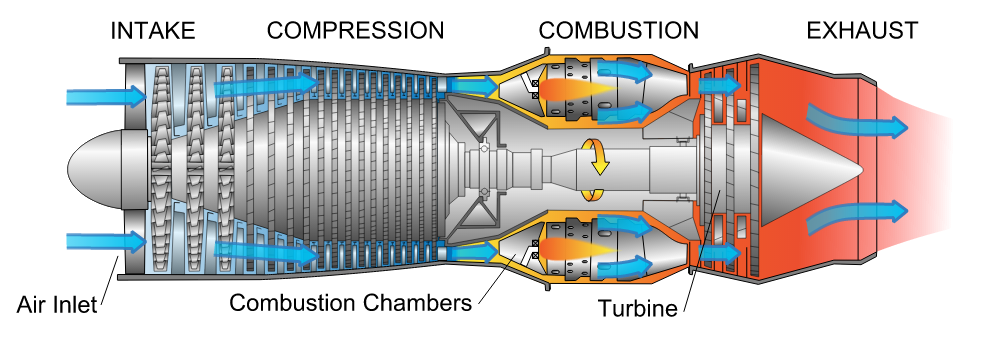
A gas turbine engine
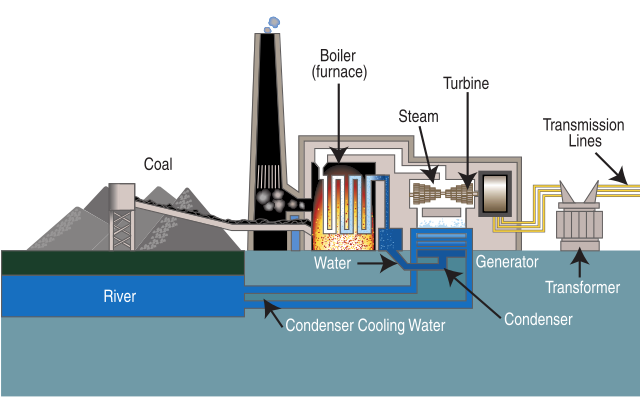
A steam coal plant
Brayton cycle vs. Rankine cycle
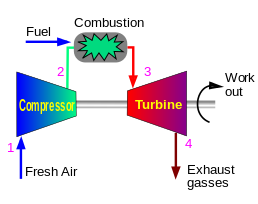
Jet engine, gas turbine
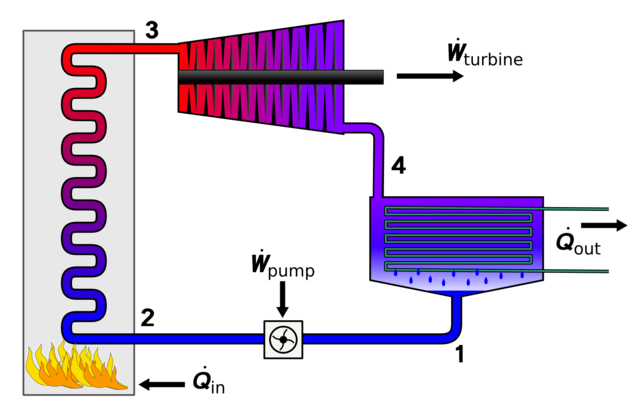
Steam engine, steam turbine
Largest coal plant in the U.S.
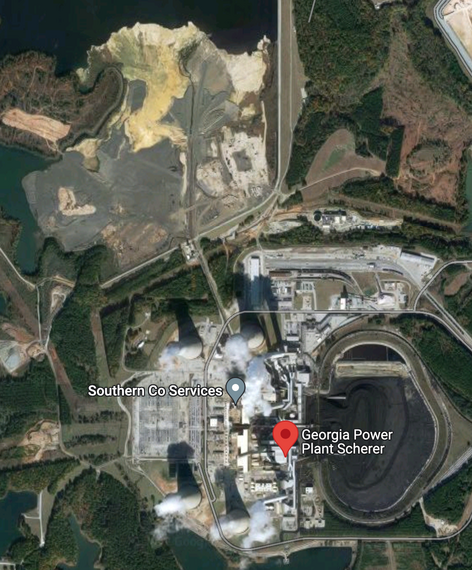
Georgia Power plant Scherer (3,720 MW)
Can you identify the components
- Coal storage
- Generating unit
- Cooling stack
- Bottom ash landfill
- Sub-station
- Transimission lines
- Waste/pollution management
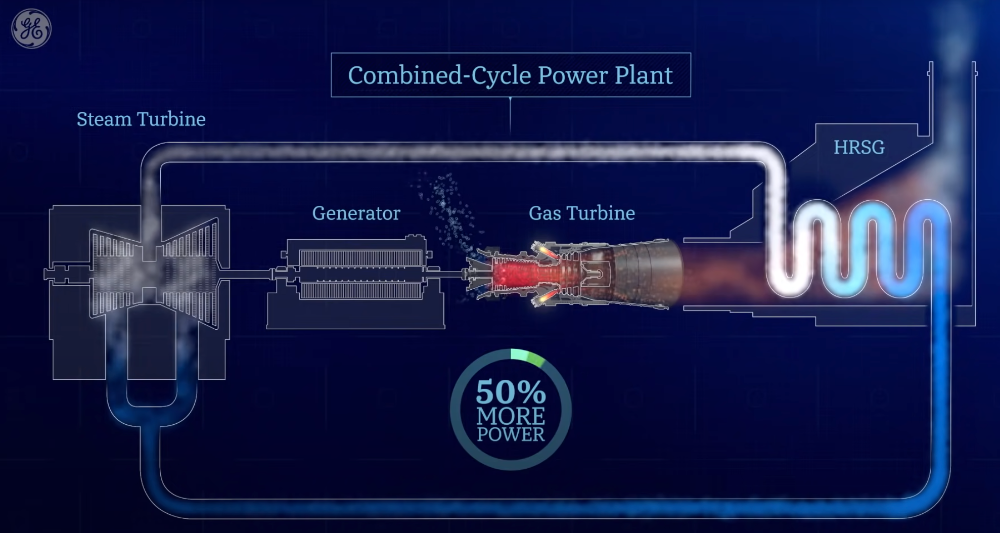
CCGT Diagram
Solar
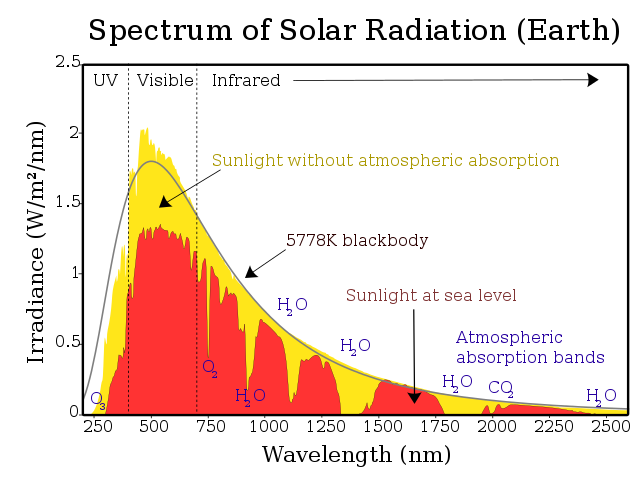
Solar spectrum
Harvesting the sun


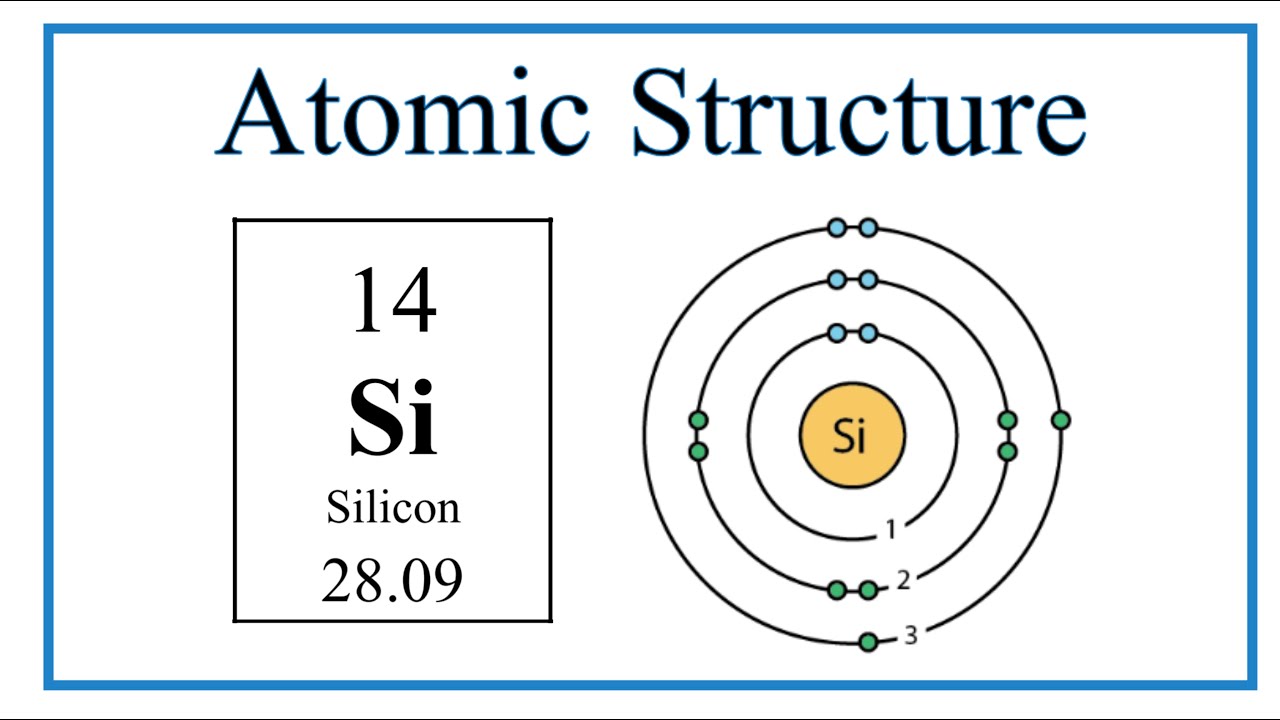
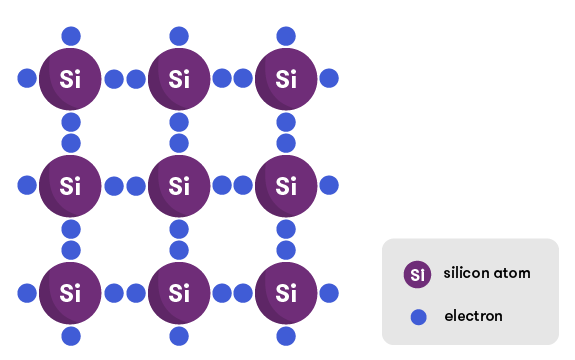
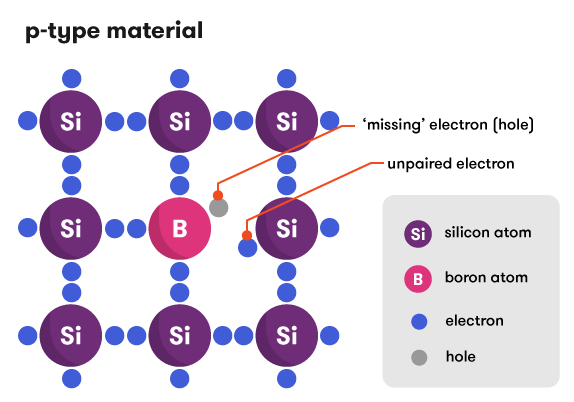
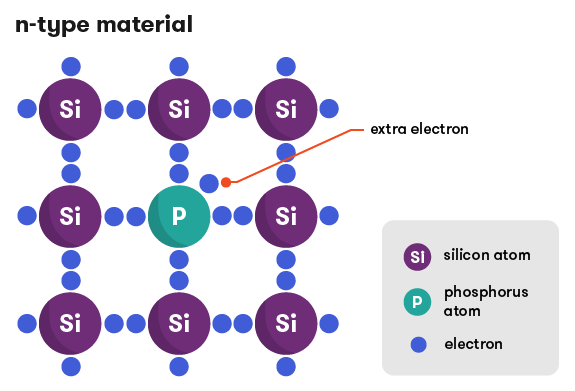
Silicon
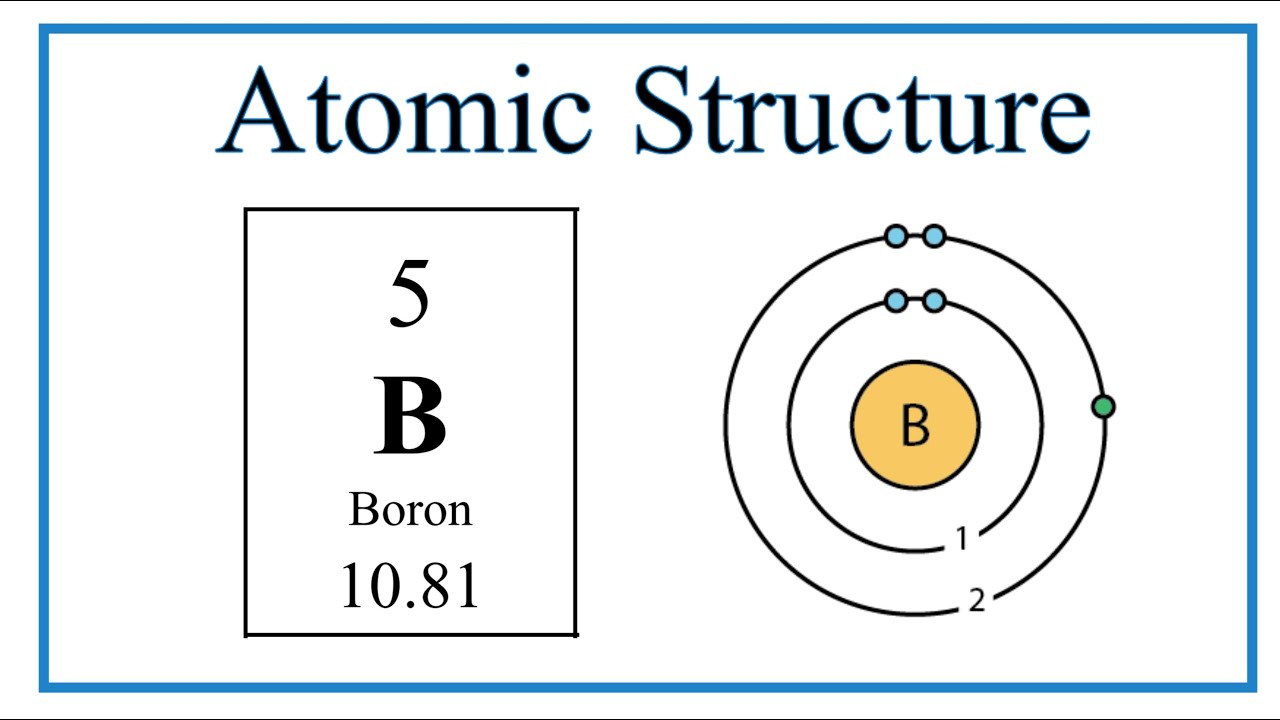
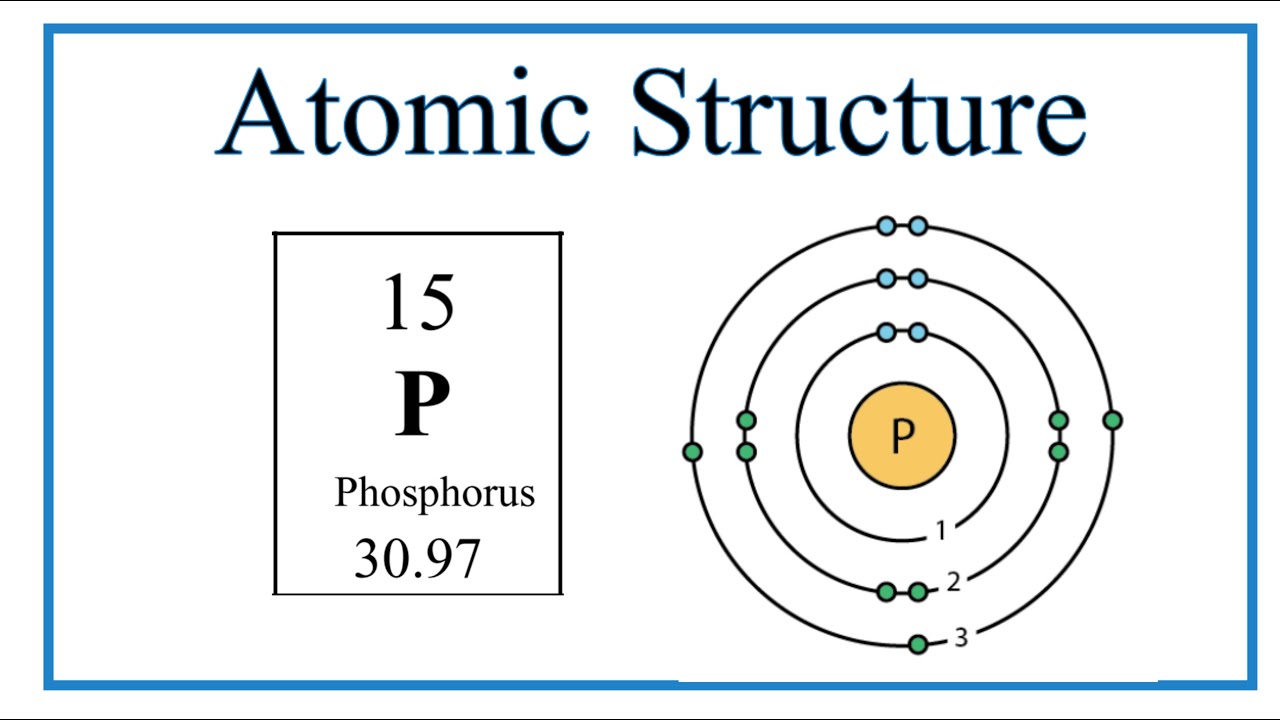
P and N type
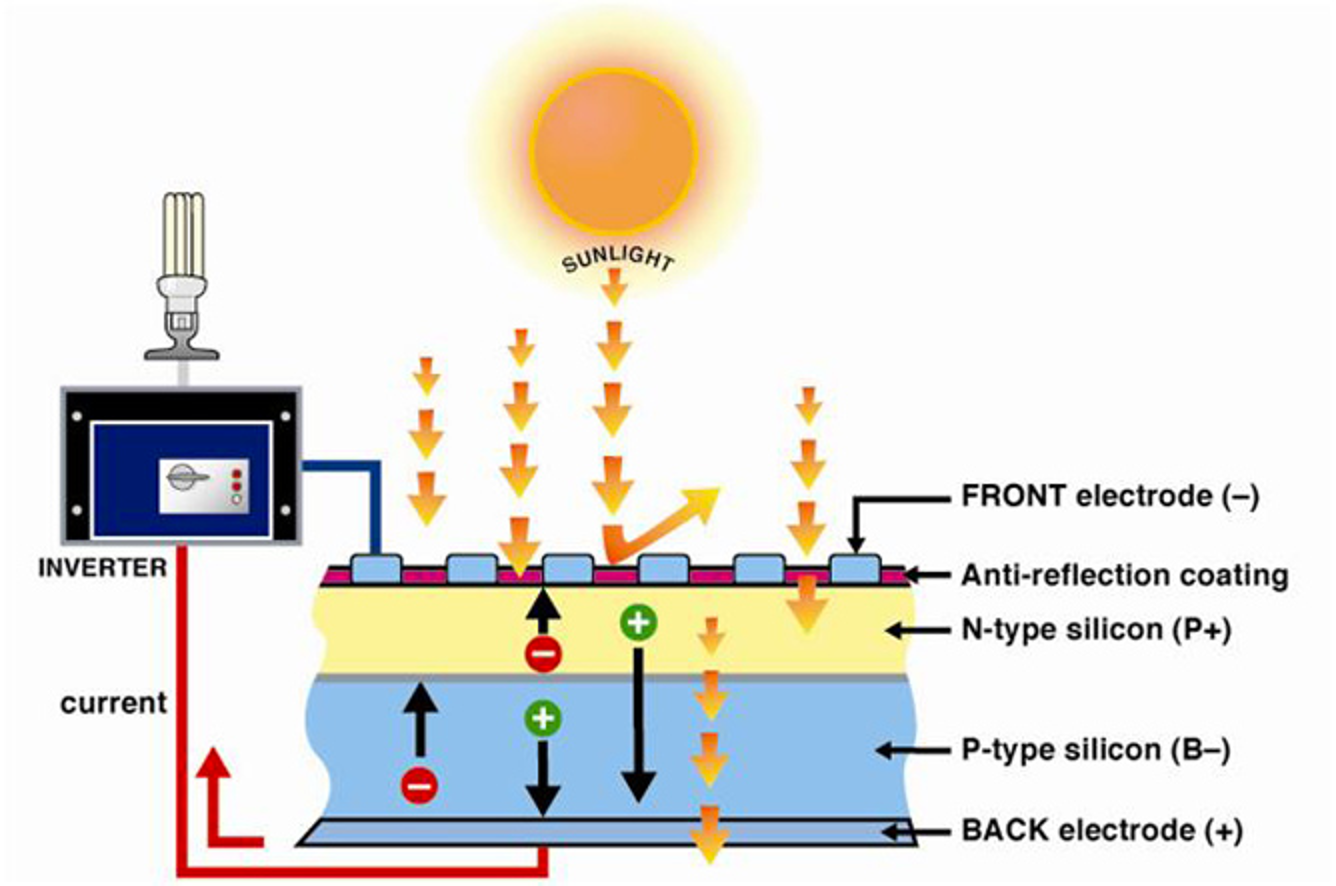
P-N Junction
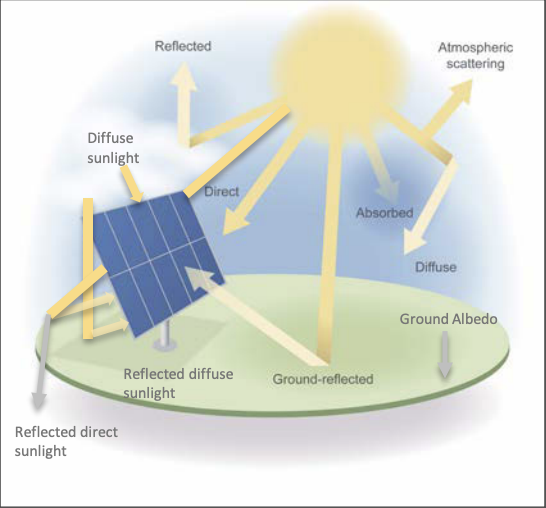
Solar irradiance
- Direct normal irradiance (DNI)
- Diffuse horizontal irradiance (DHI)
- Ground reflected irradiance (GRI)
- Global horizontal irradiance (GHI)
- Plane-of-array irradiance (POA)
GHI=DNI+DHI+GRI
POA = GHI \(\times \cos \theta\)
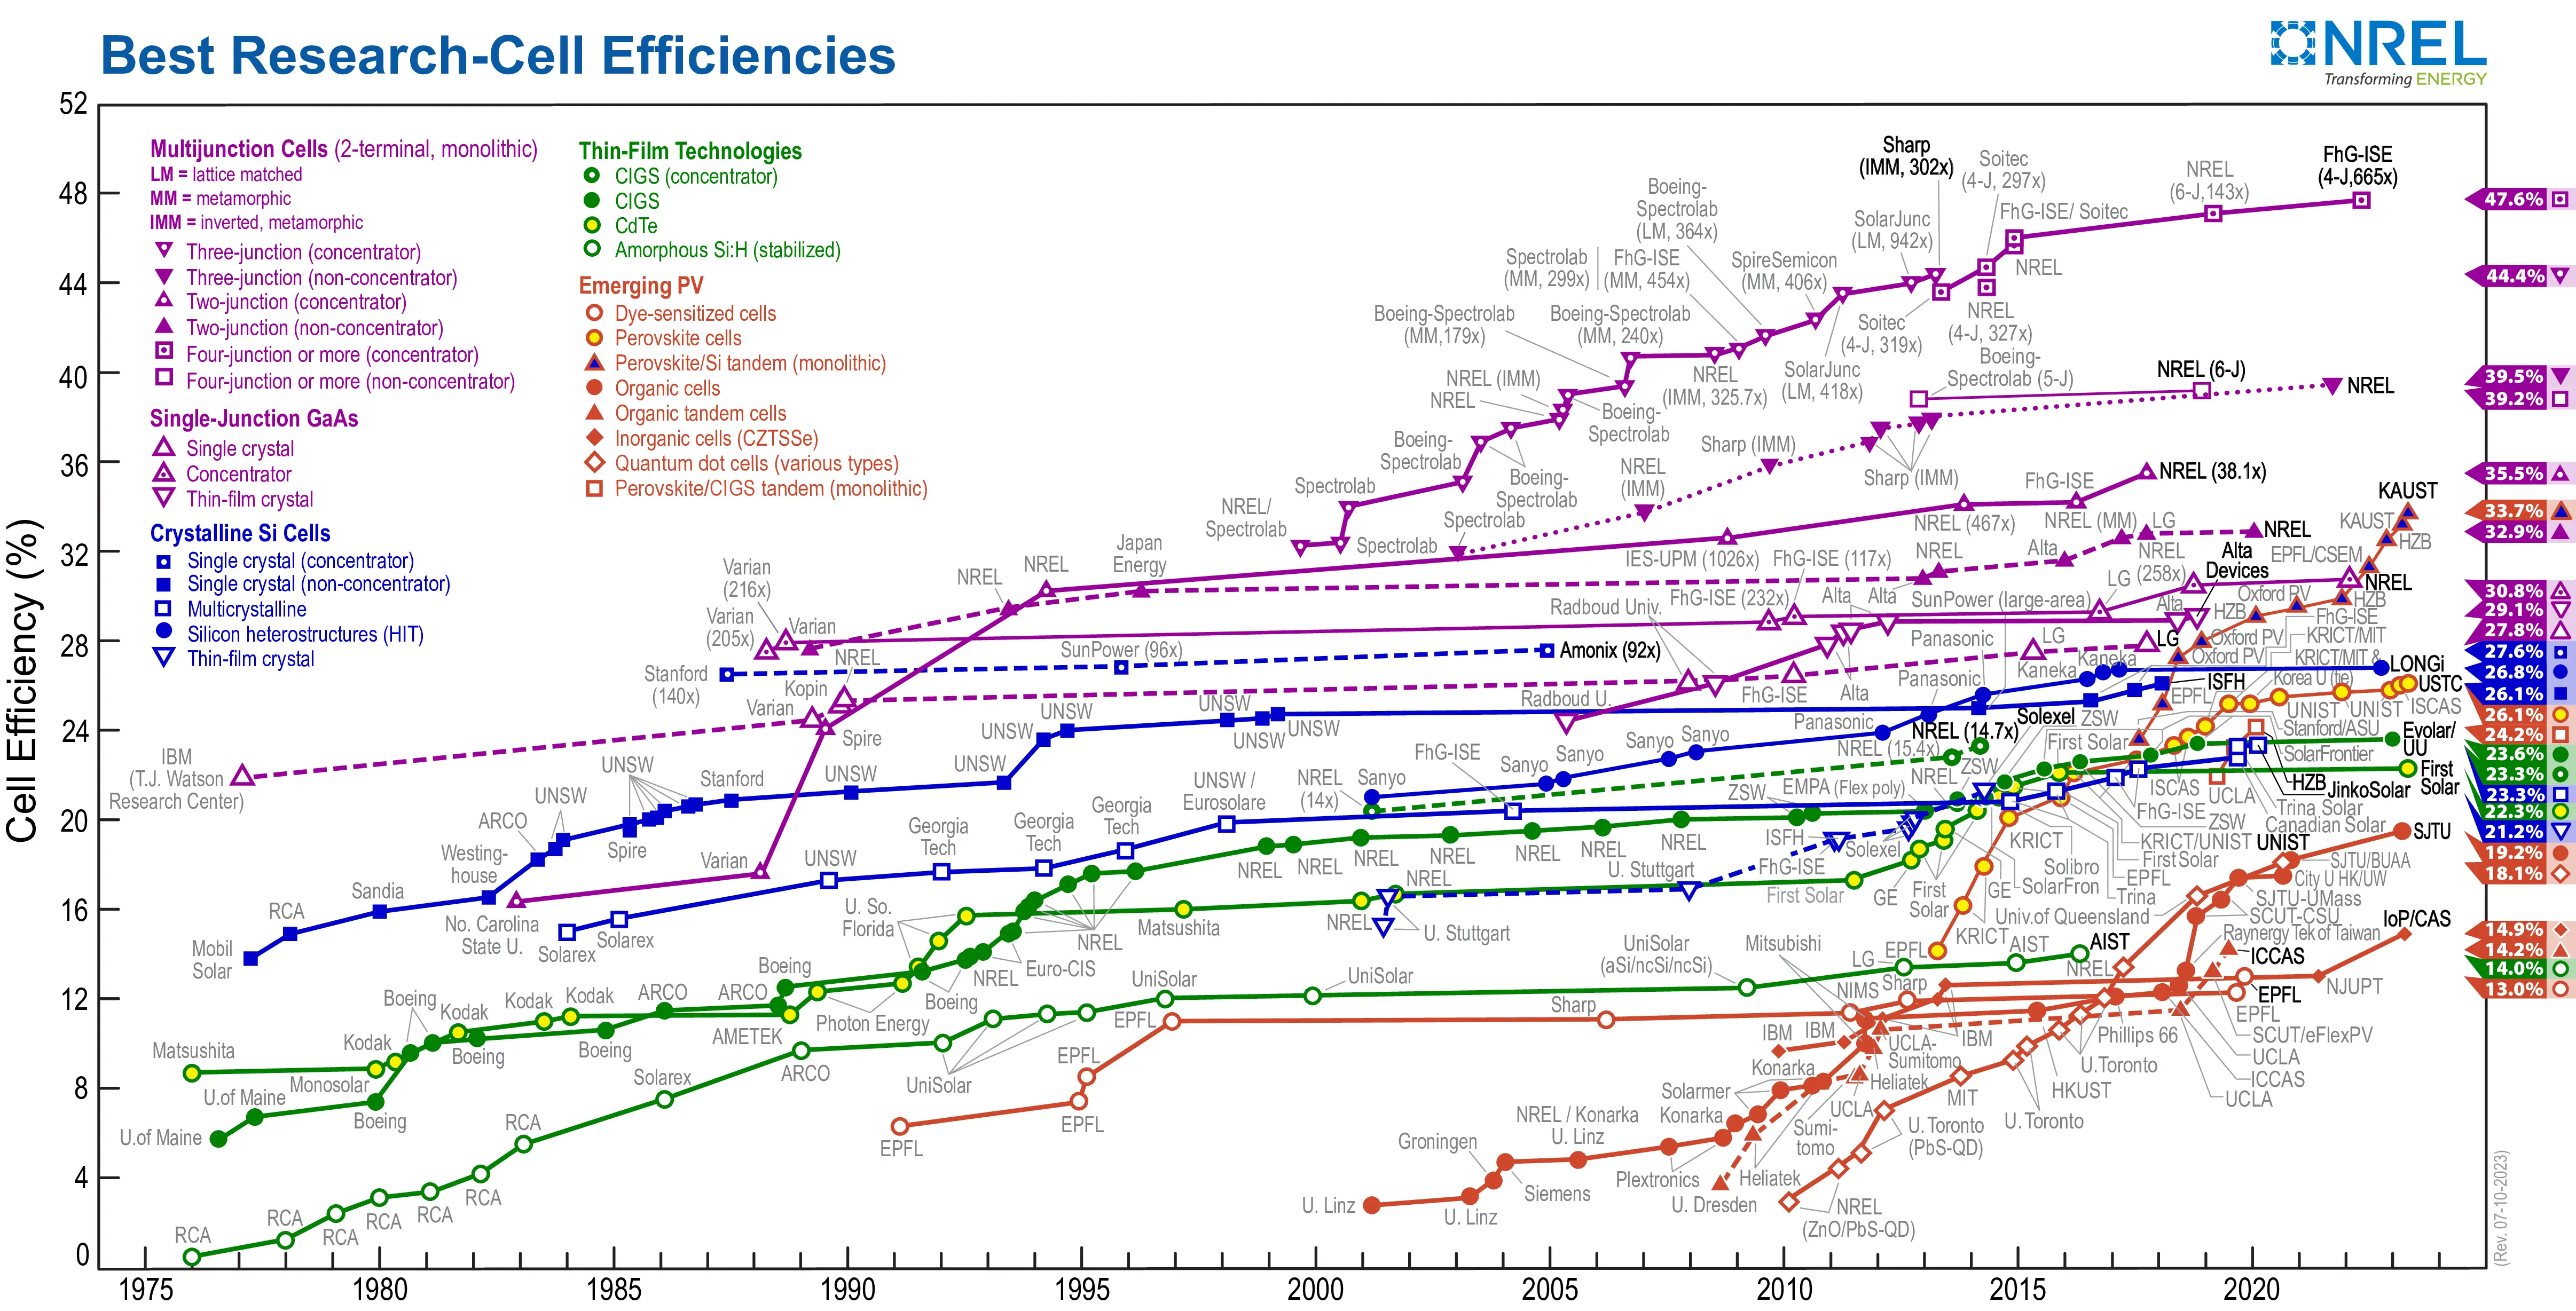
The quest for efficiency
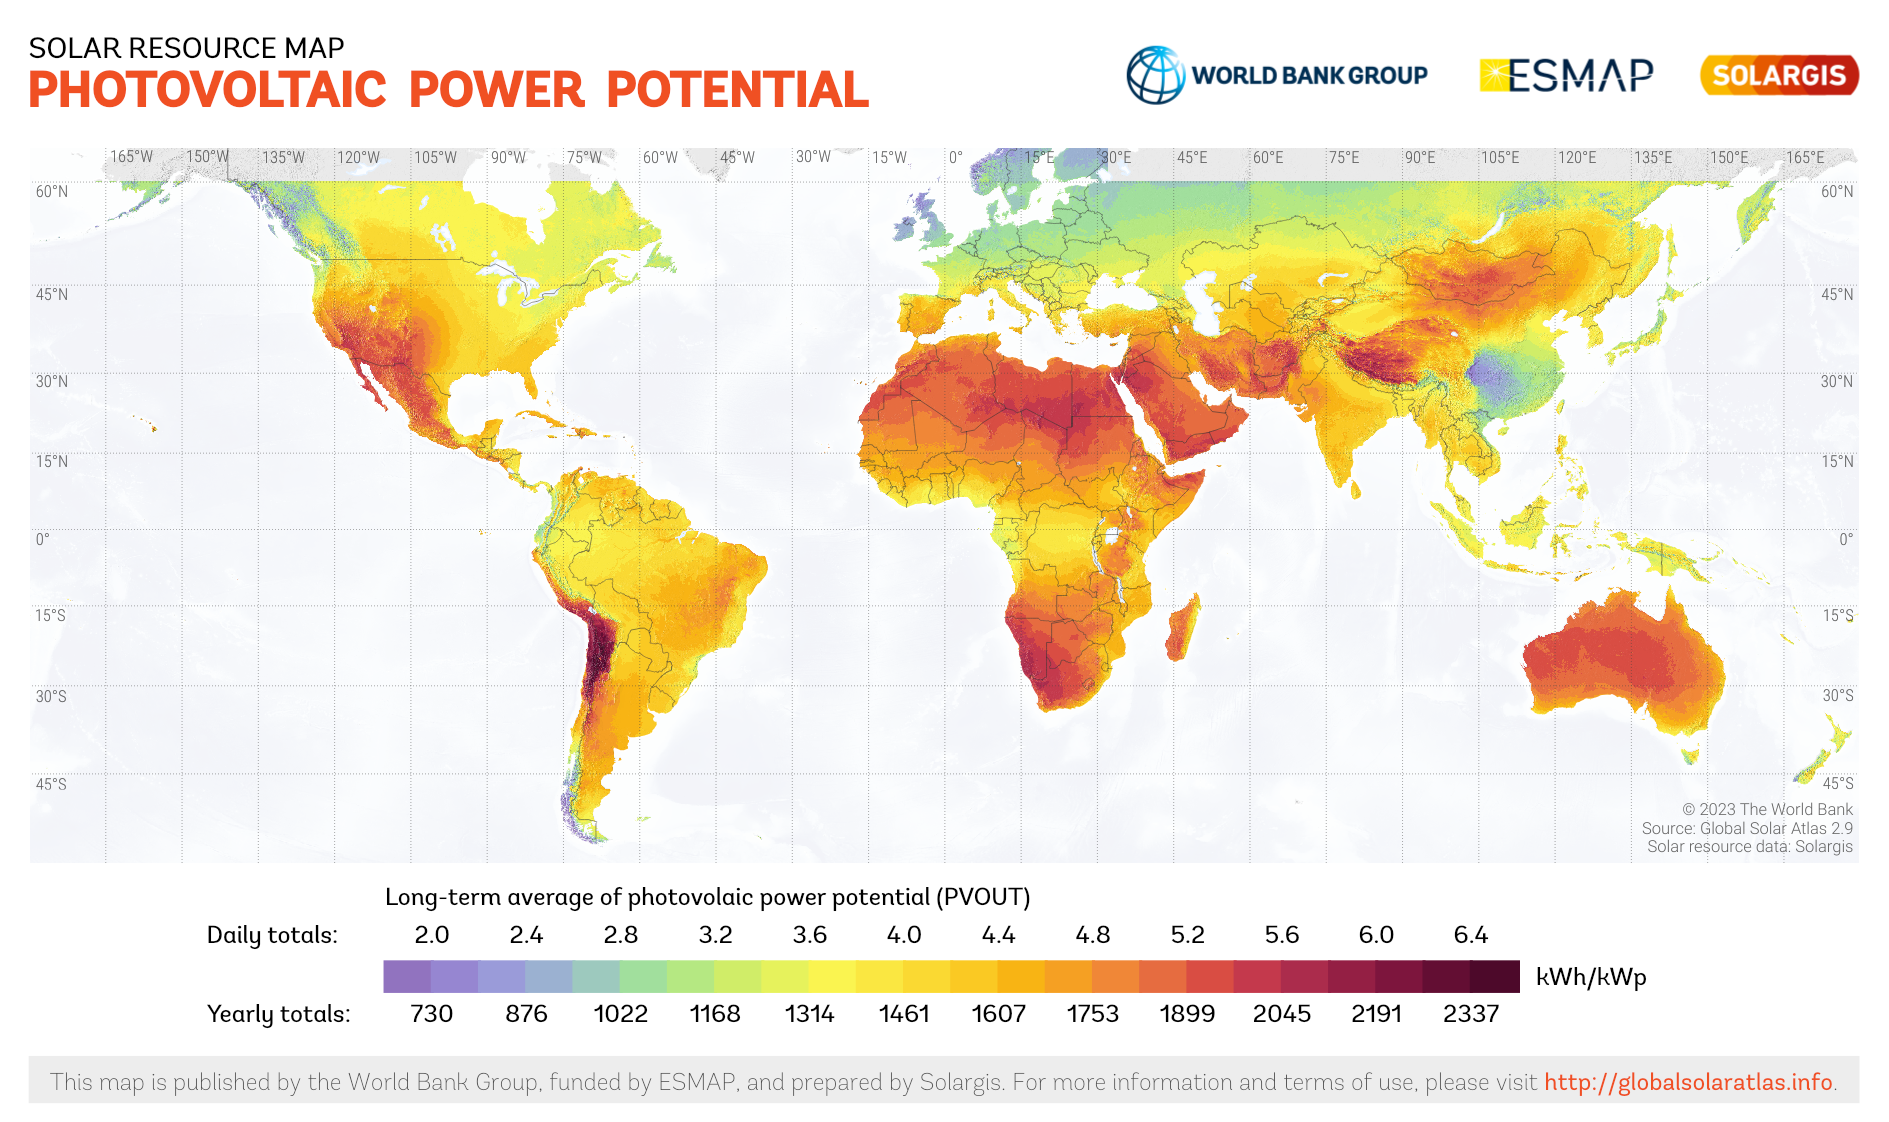
Global and U.S. distribution
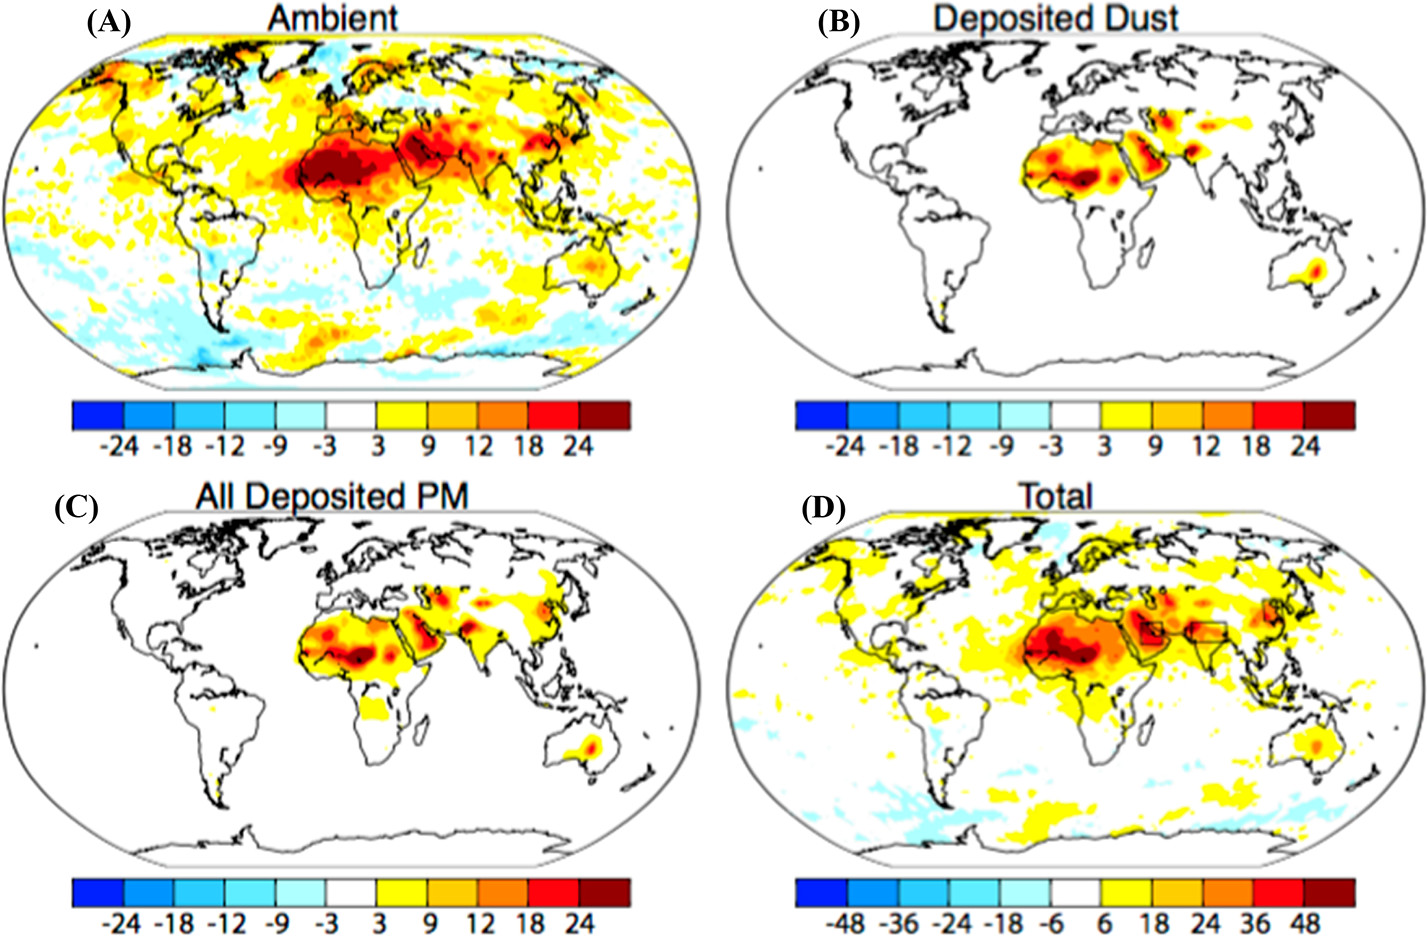
Air pollution and dust
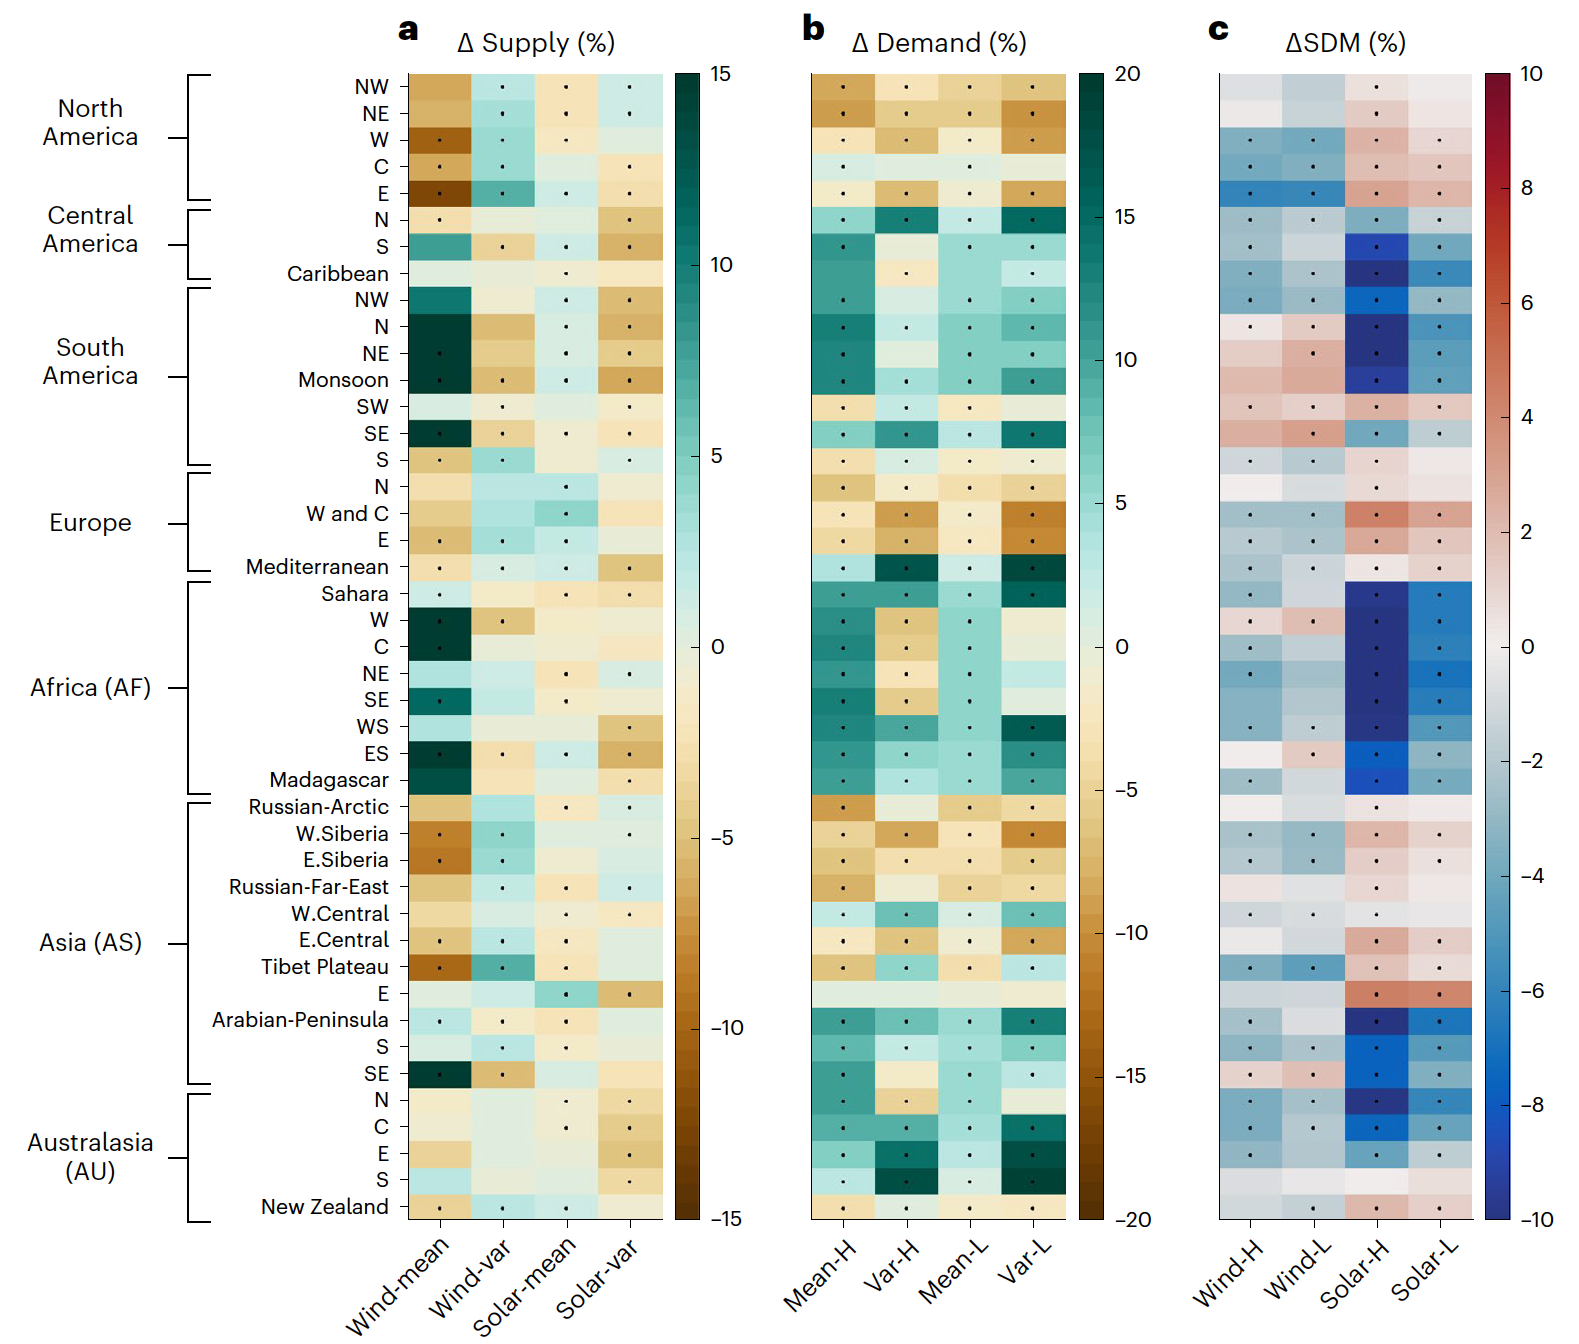
Climate change impact
Prioritize solar installation
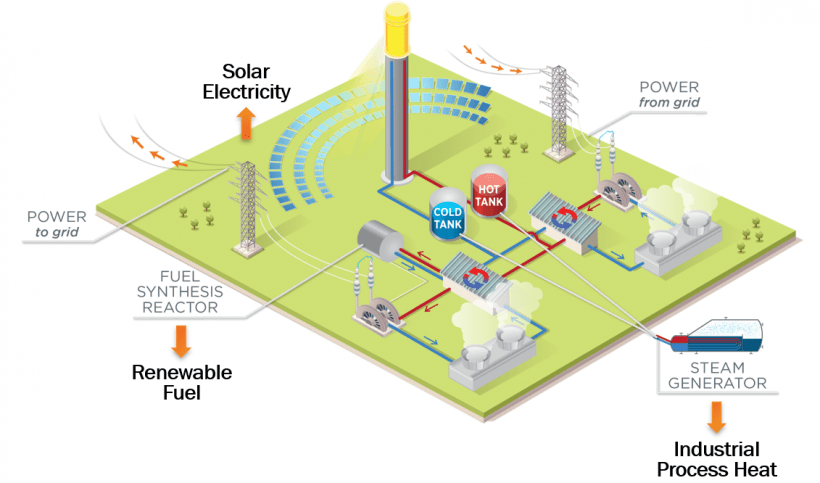
Solar thermal: CSP
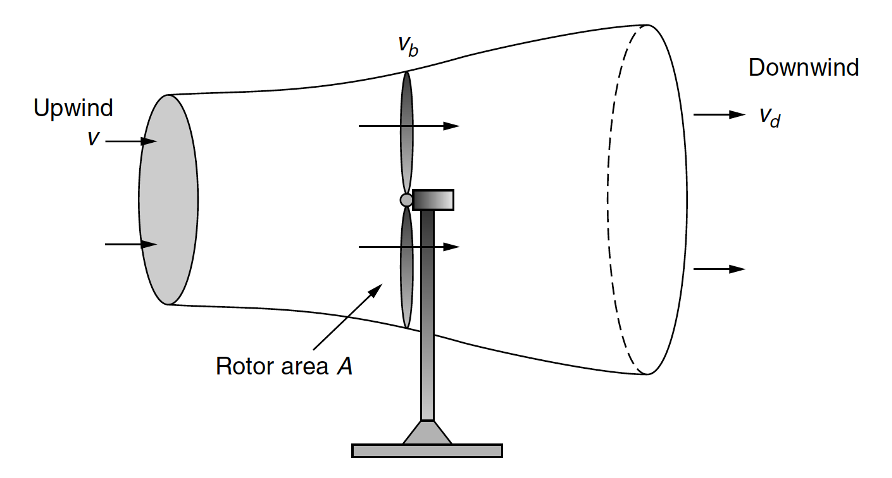
Wind
\(P=\frac{1}{2}\rho \pi r^2 v^3\)
Where,
\(\rho\) = Air Density (\(kg/m^3\))
\(A\) = Swept Area (m2) = \(\pi r^2\)
\(v\) = Wind Speed (m/s)
\(P\) = Power (W)
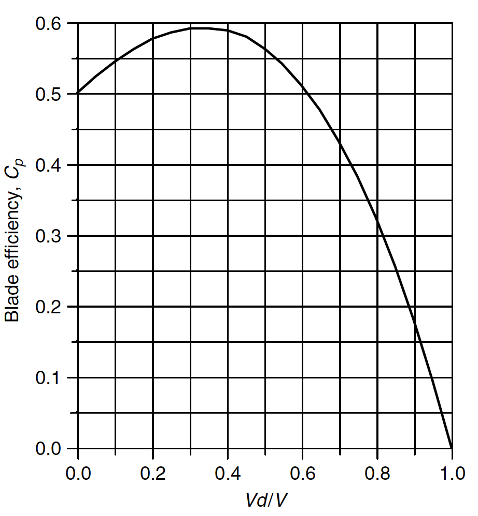
Betz’s law: 59.3%
Average power
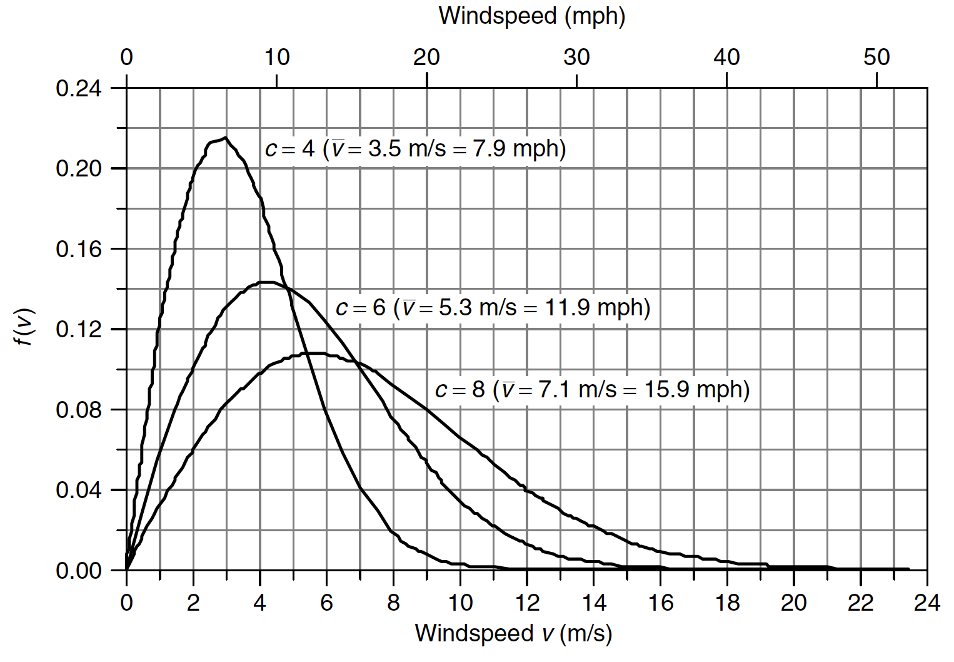
Rayleigh (a special type of Weibull) distribution
\(f(v)=\frac{2v}{c^2}\exp [-(\frac{v}{c})^2]\)
\(\bar{P}=\frac{6}{\pi}\cdot \frac{1}{2}\rho \pi r^2 (\bar{v})^3=1.91P\)
Use average power when dealing with average wind speed
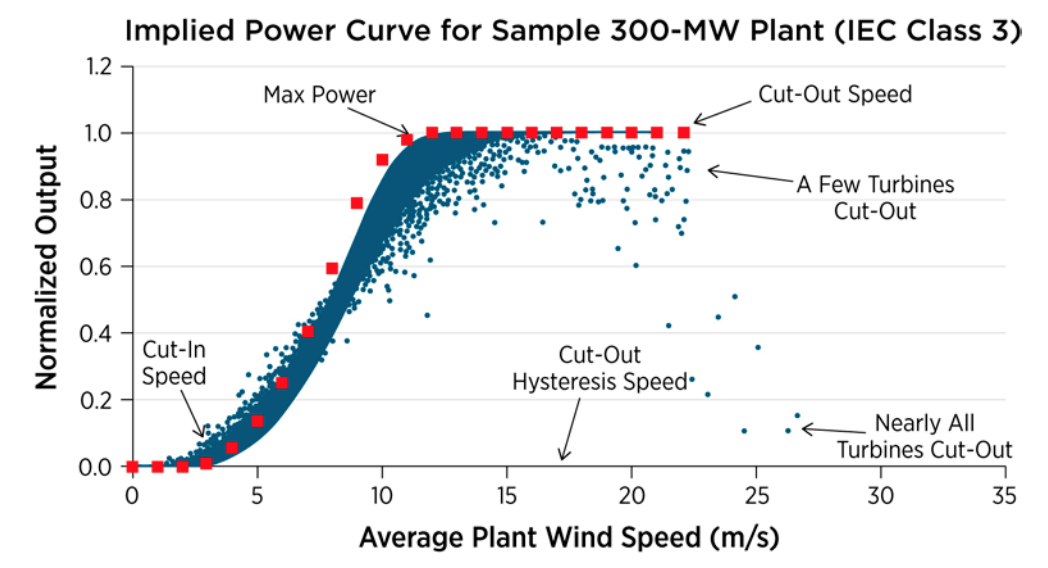
Power curve
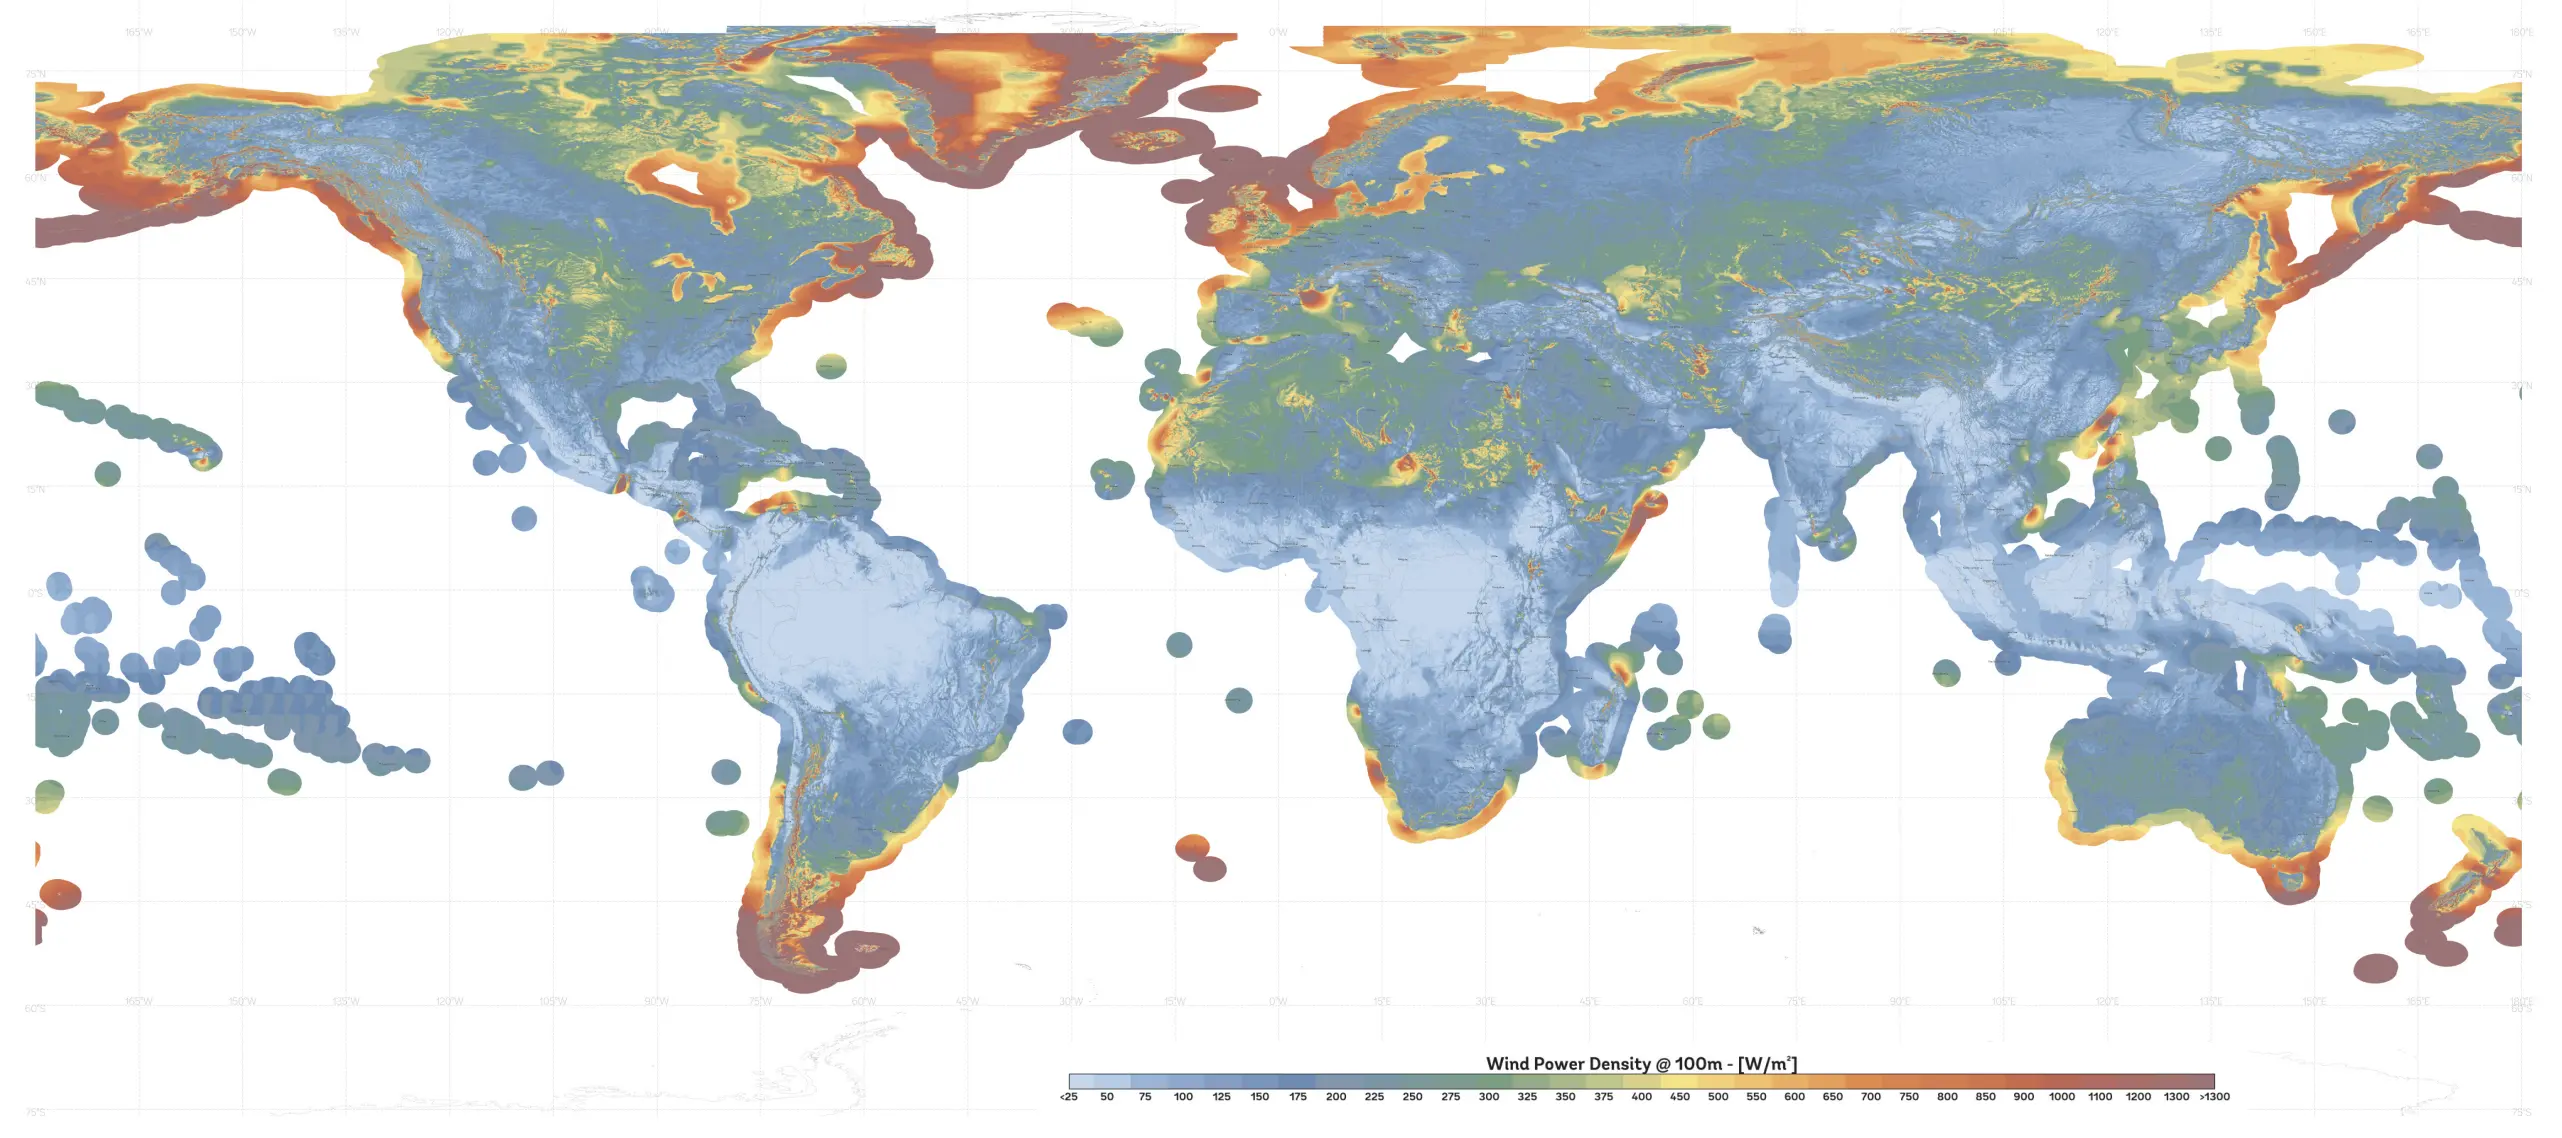
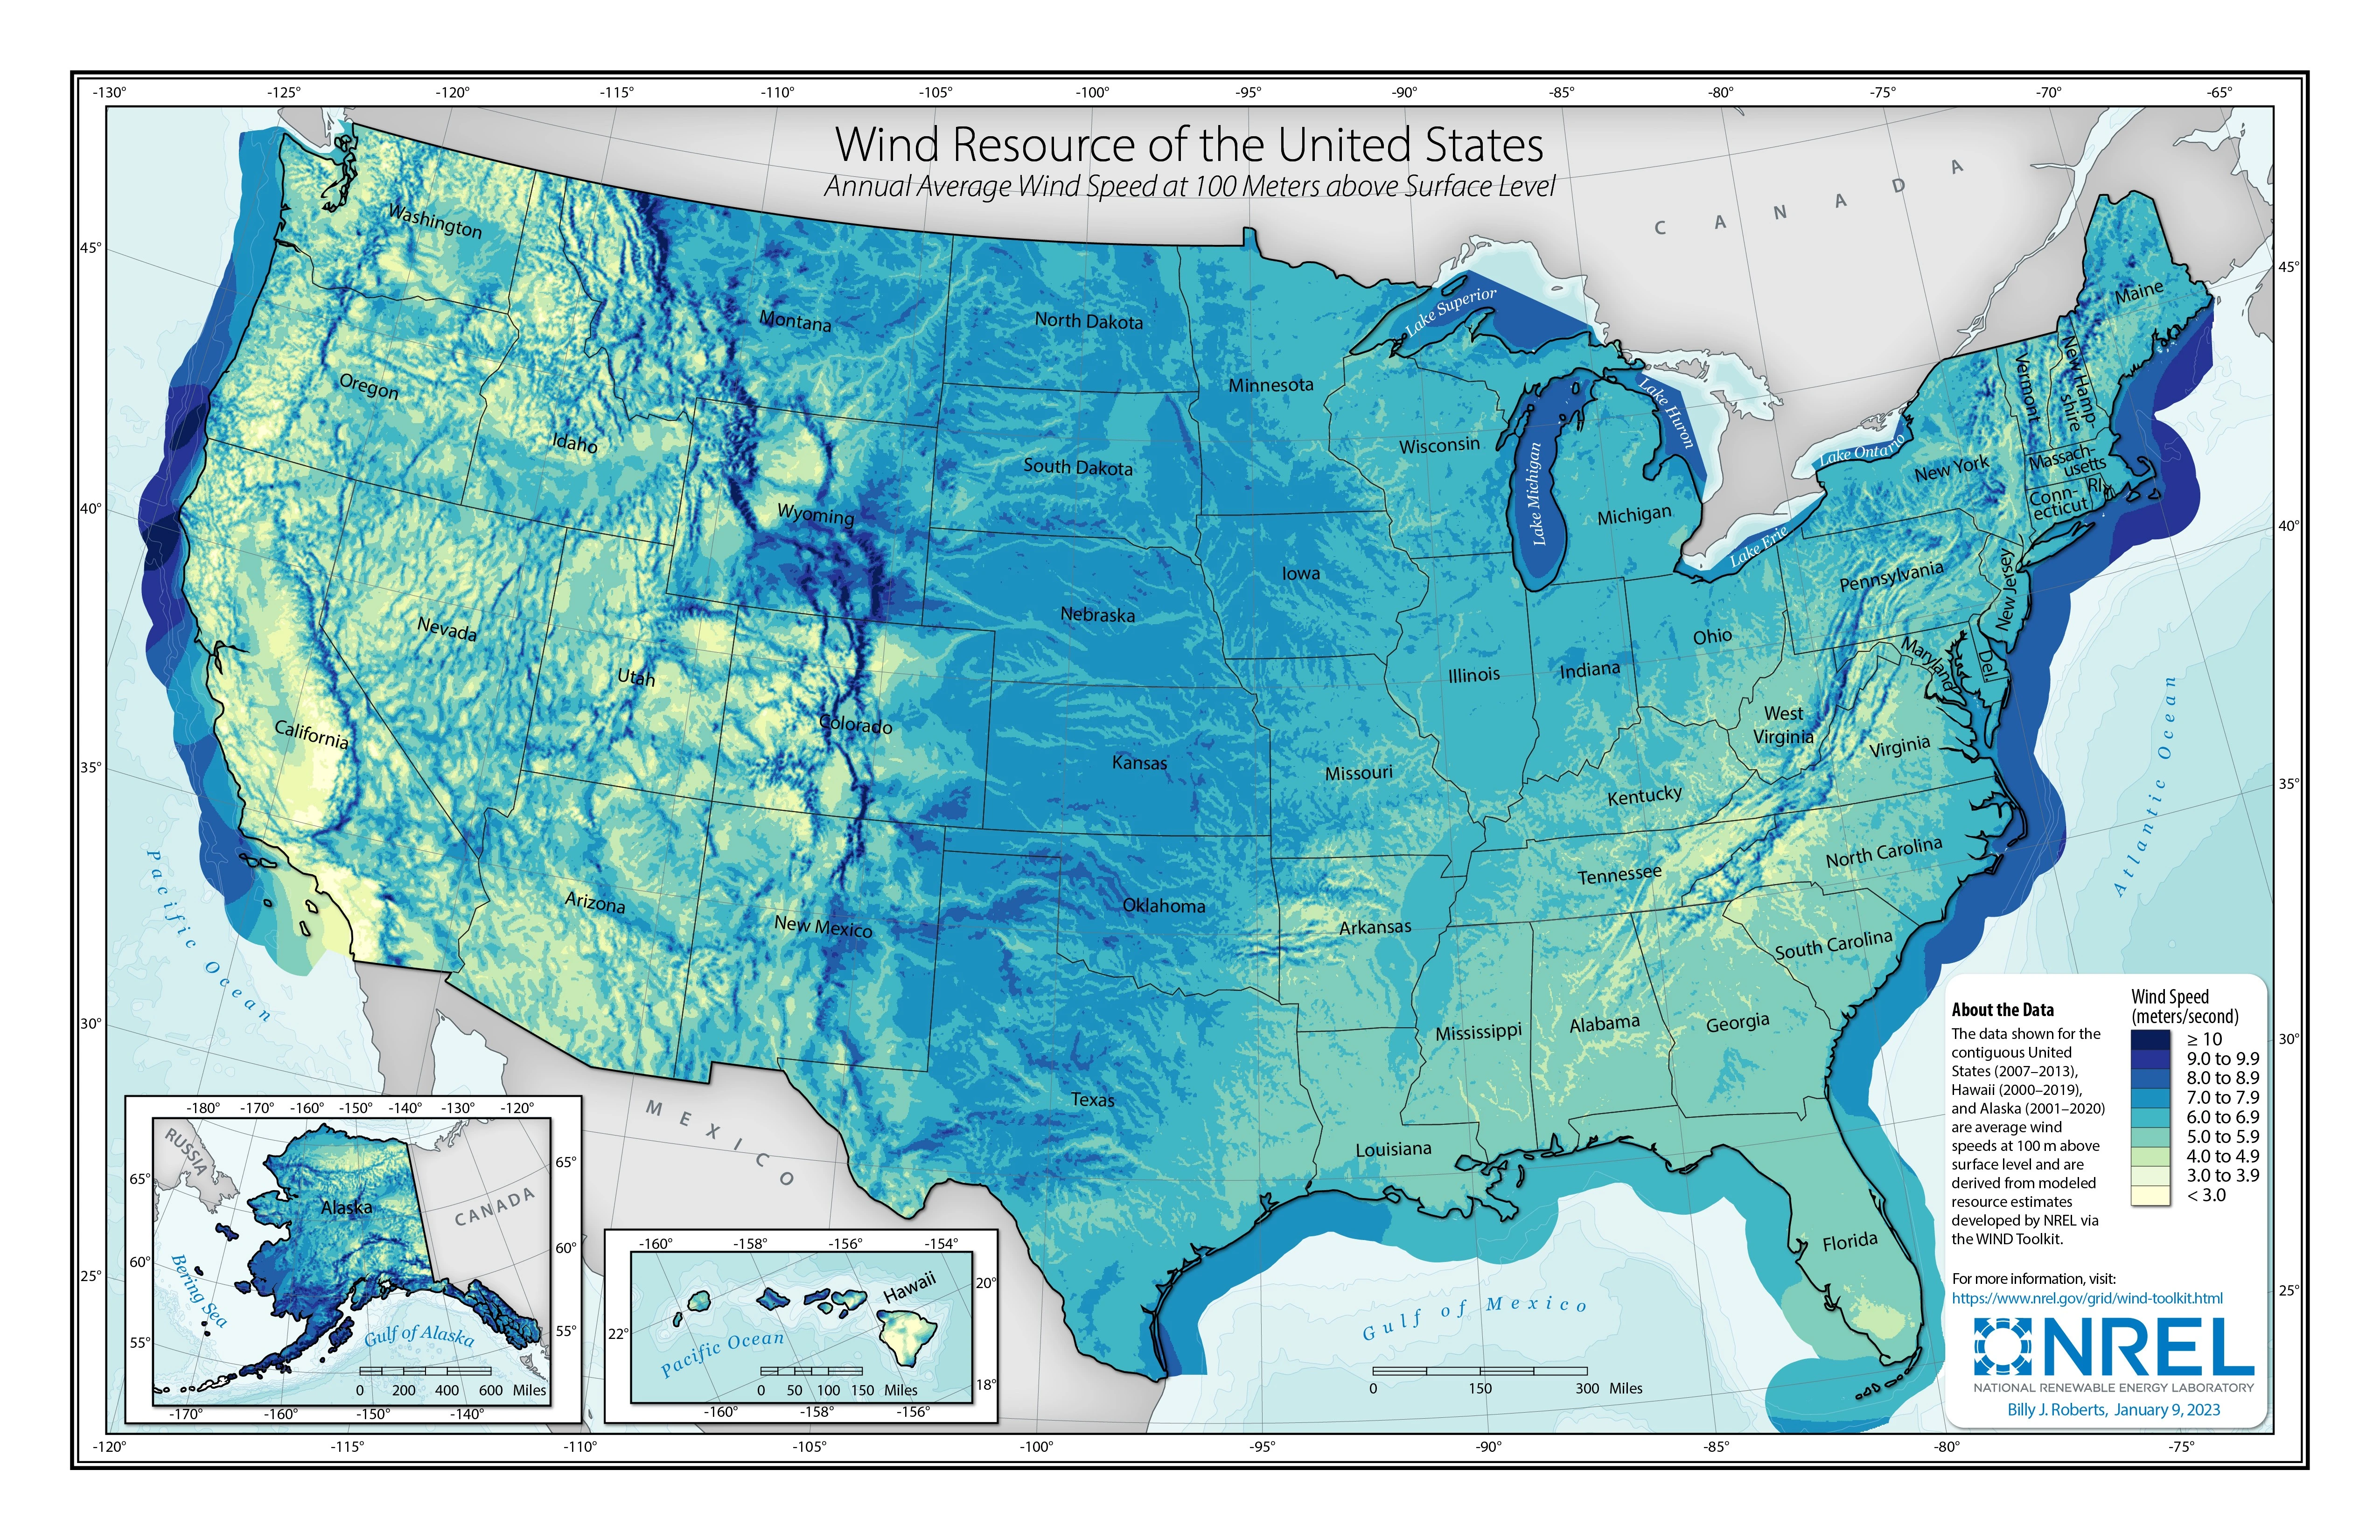
Global wind power density map
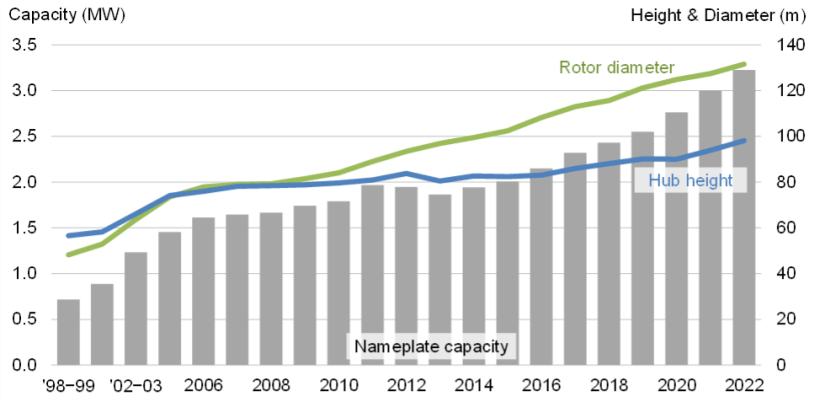
Higher and bigger
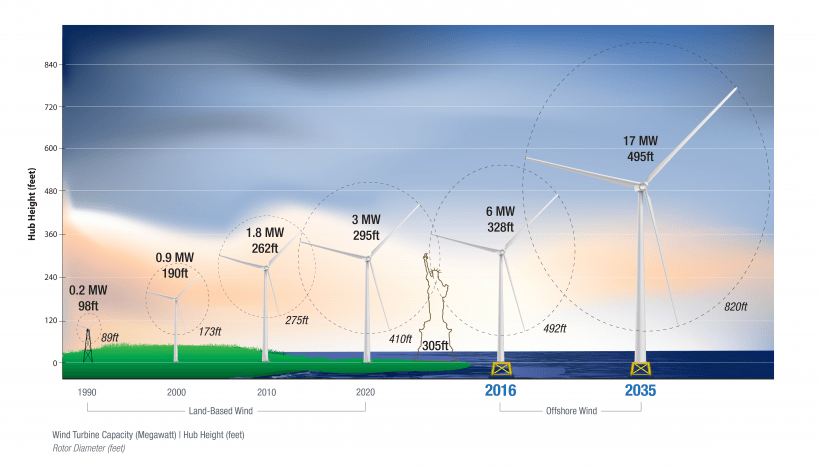
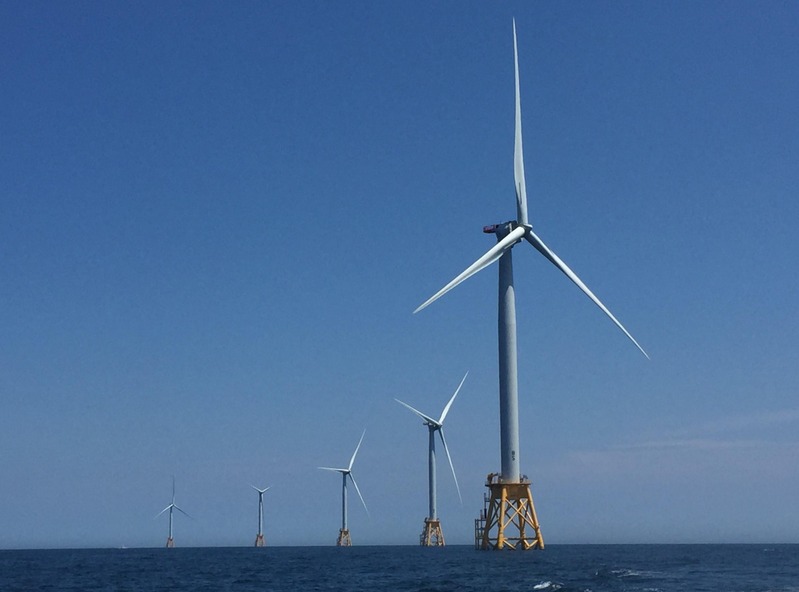
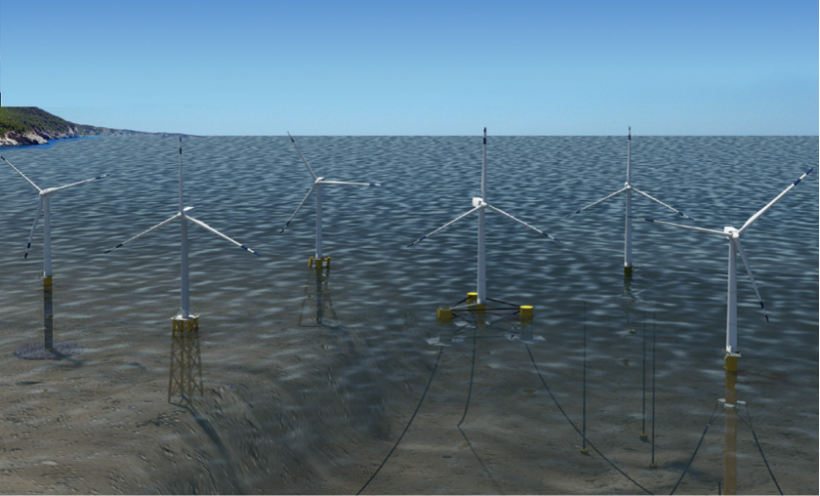
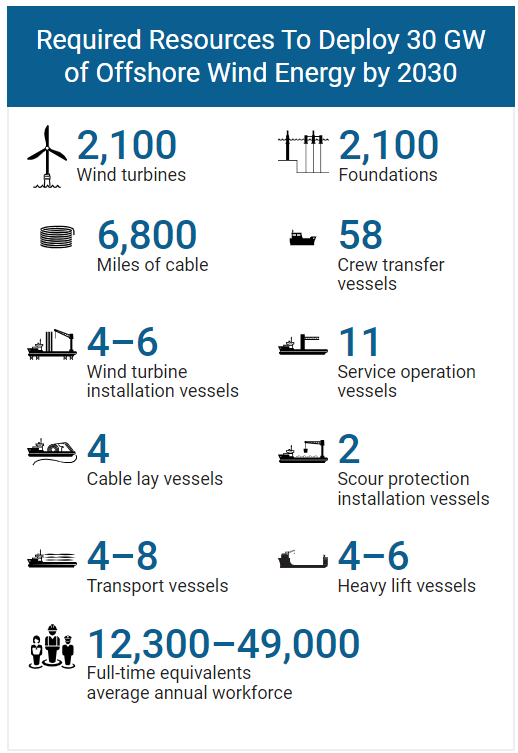
Offshore wind
Challenges
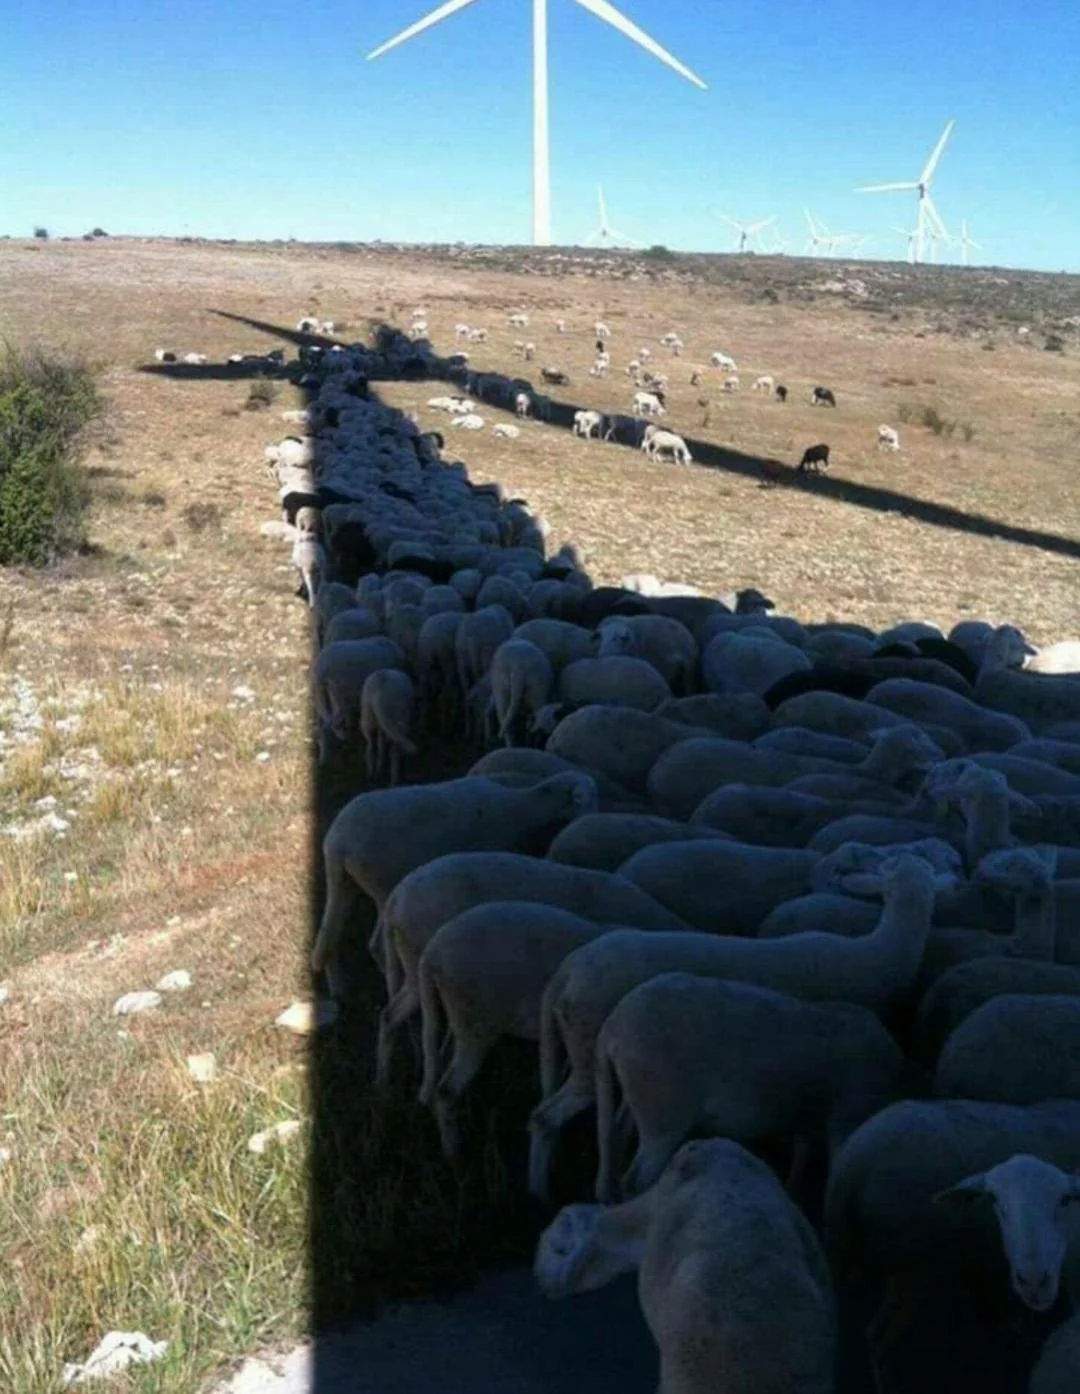
Unexpected benefits
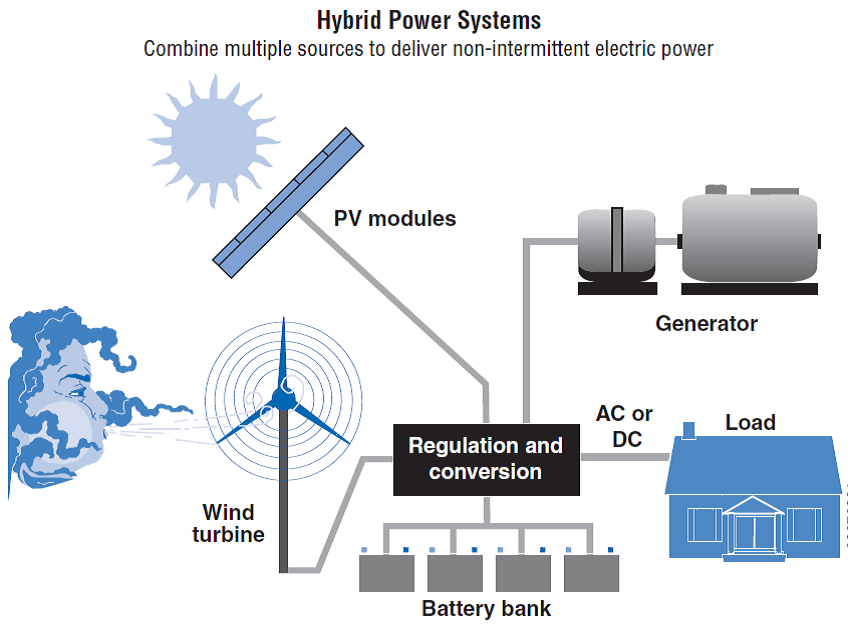
Hybrid power systems