Lecture 7 Energy Conversion Technologies: Solar and Wind
October 23, 2023
Solar

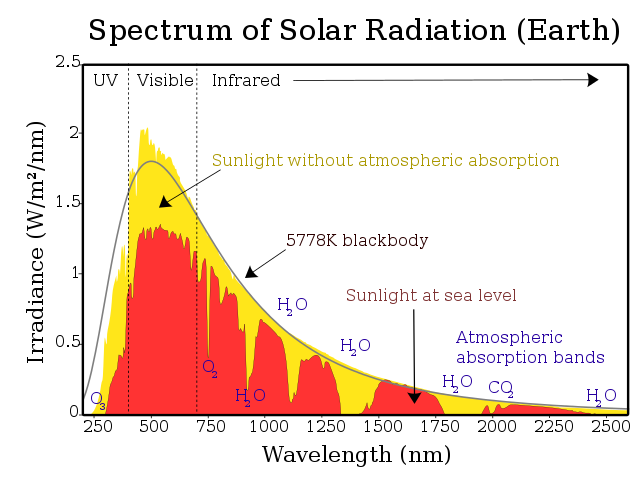
Solar spectrum
Harvesting the sun

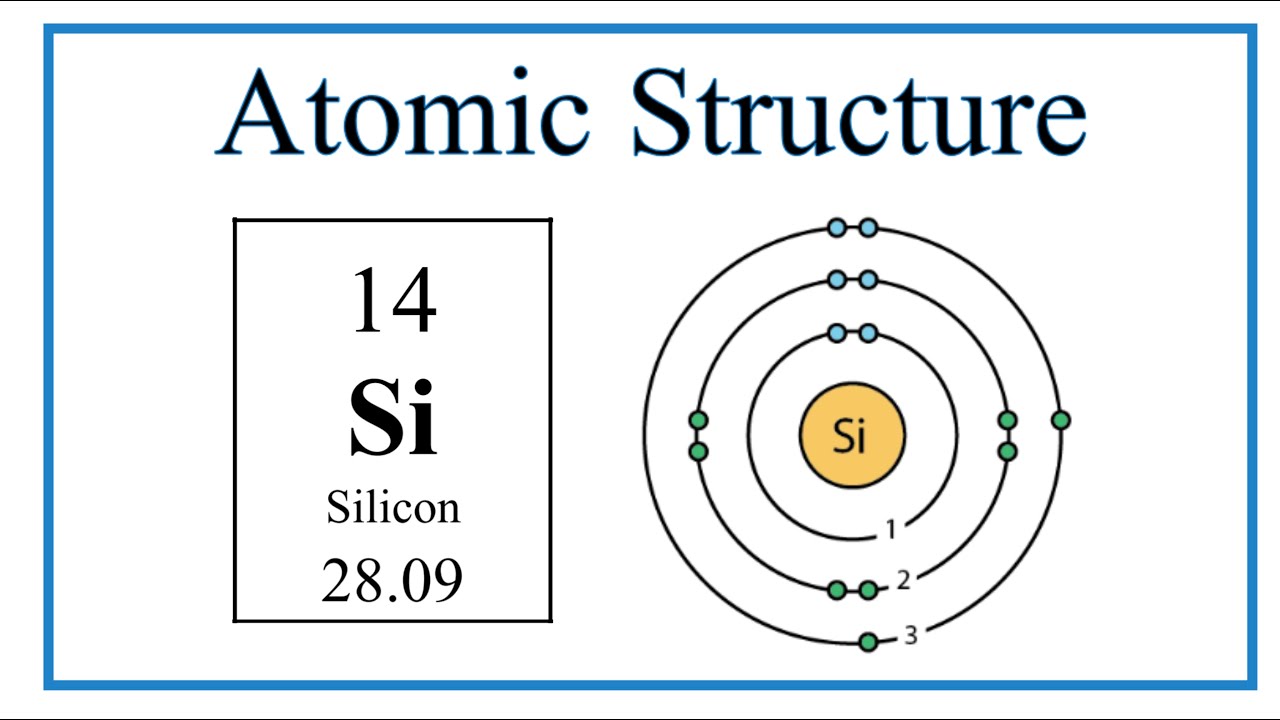
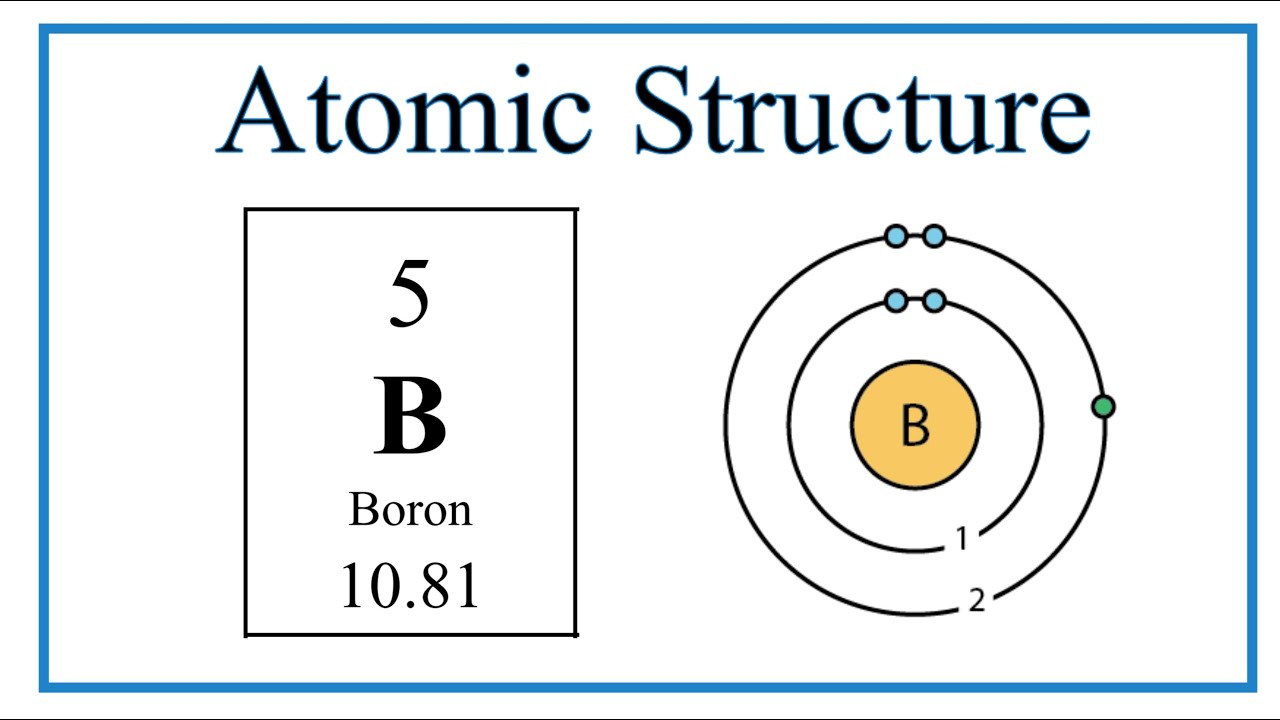
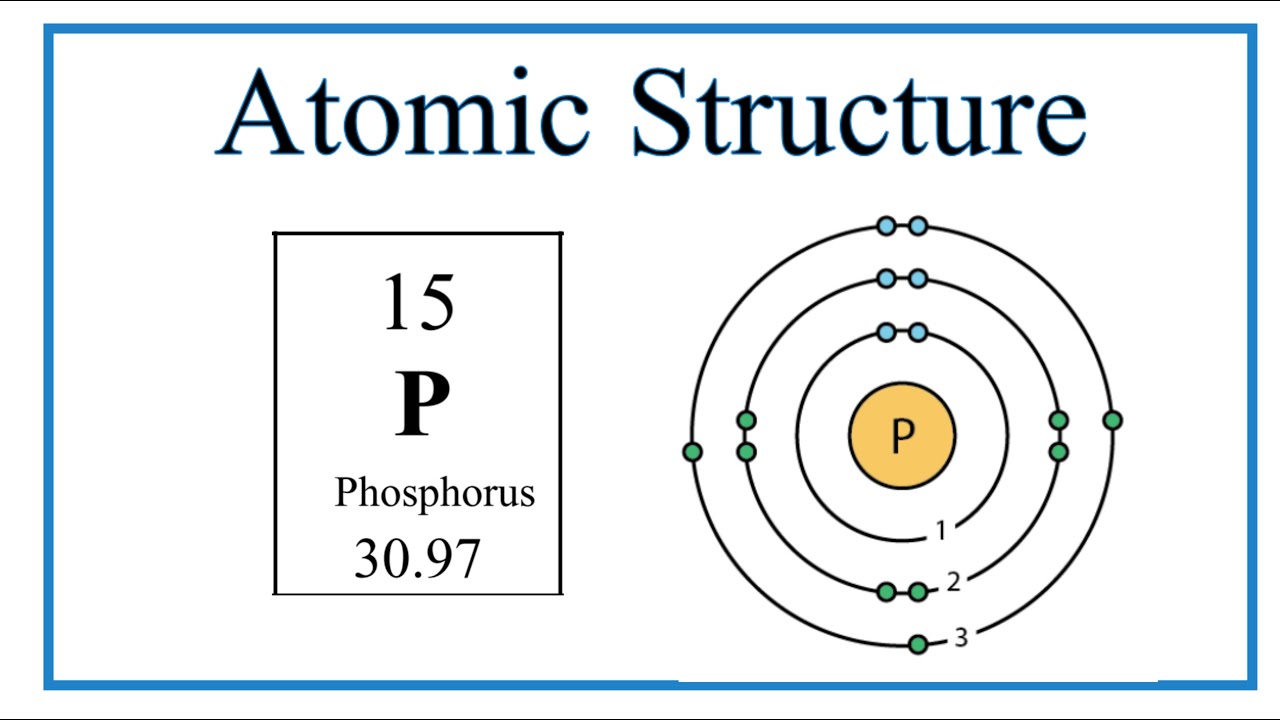
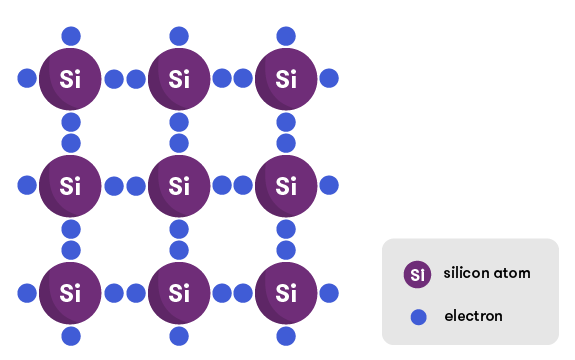
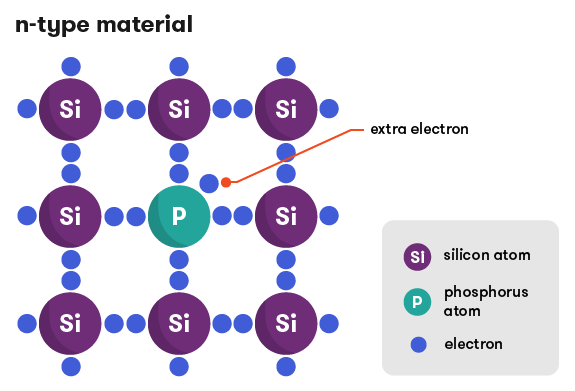
Silicon
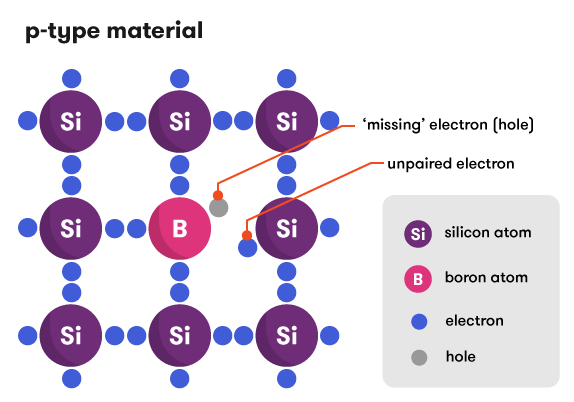
P and N type
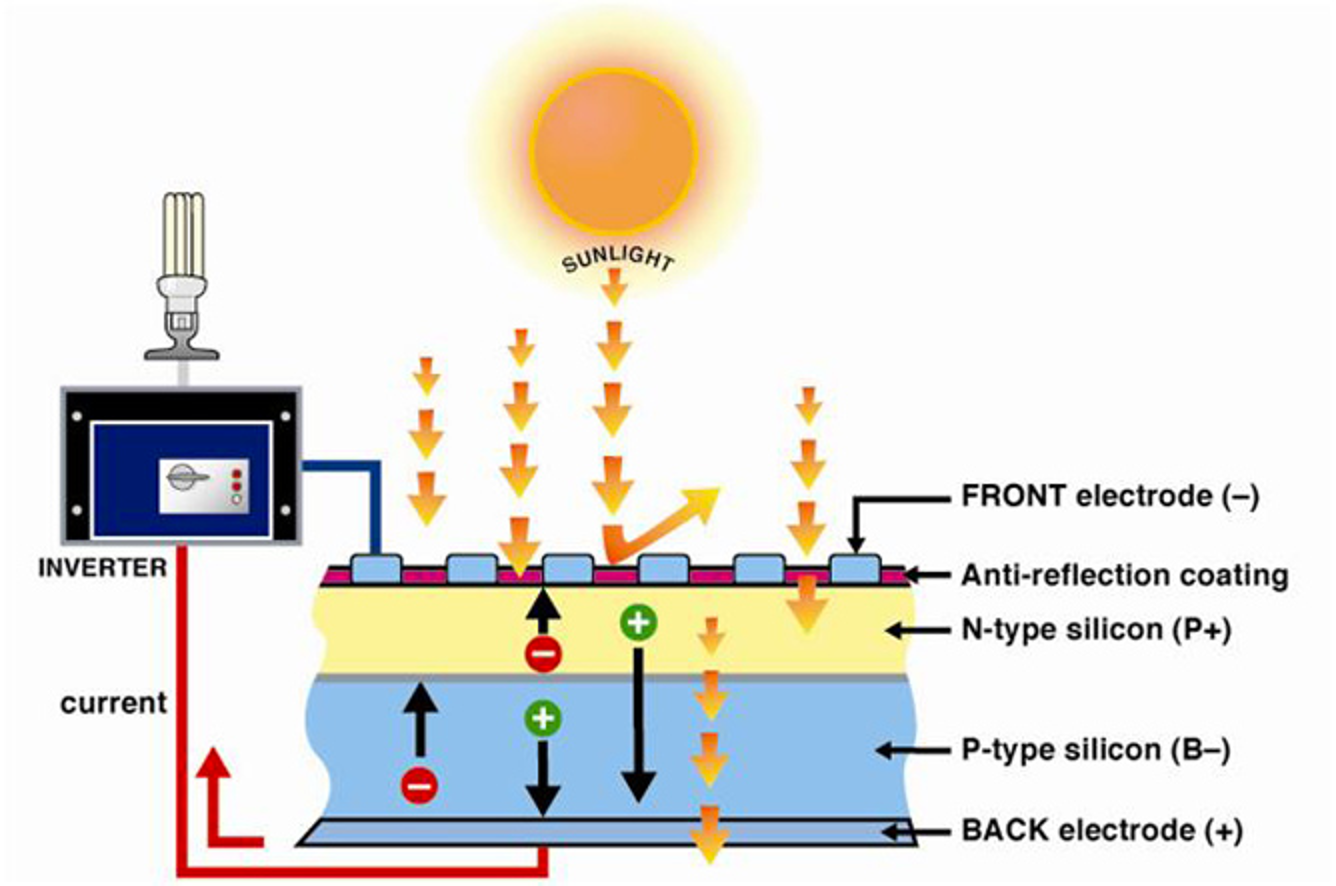
P-N Junction
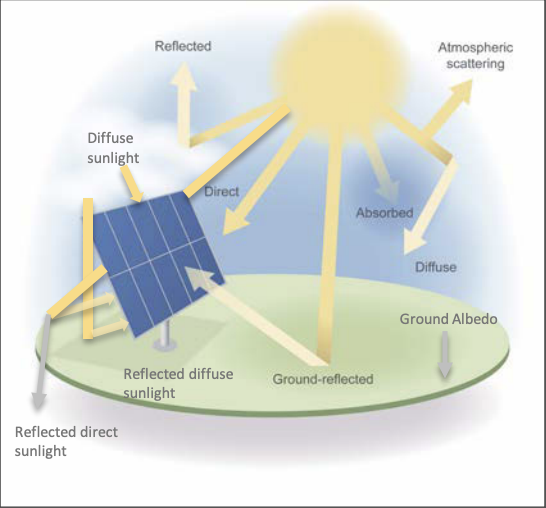
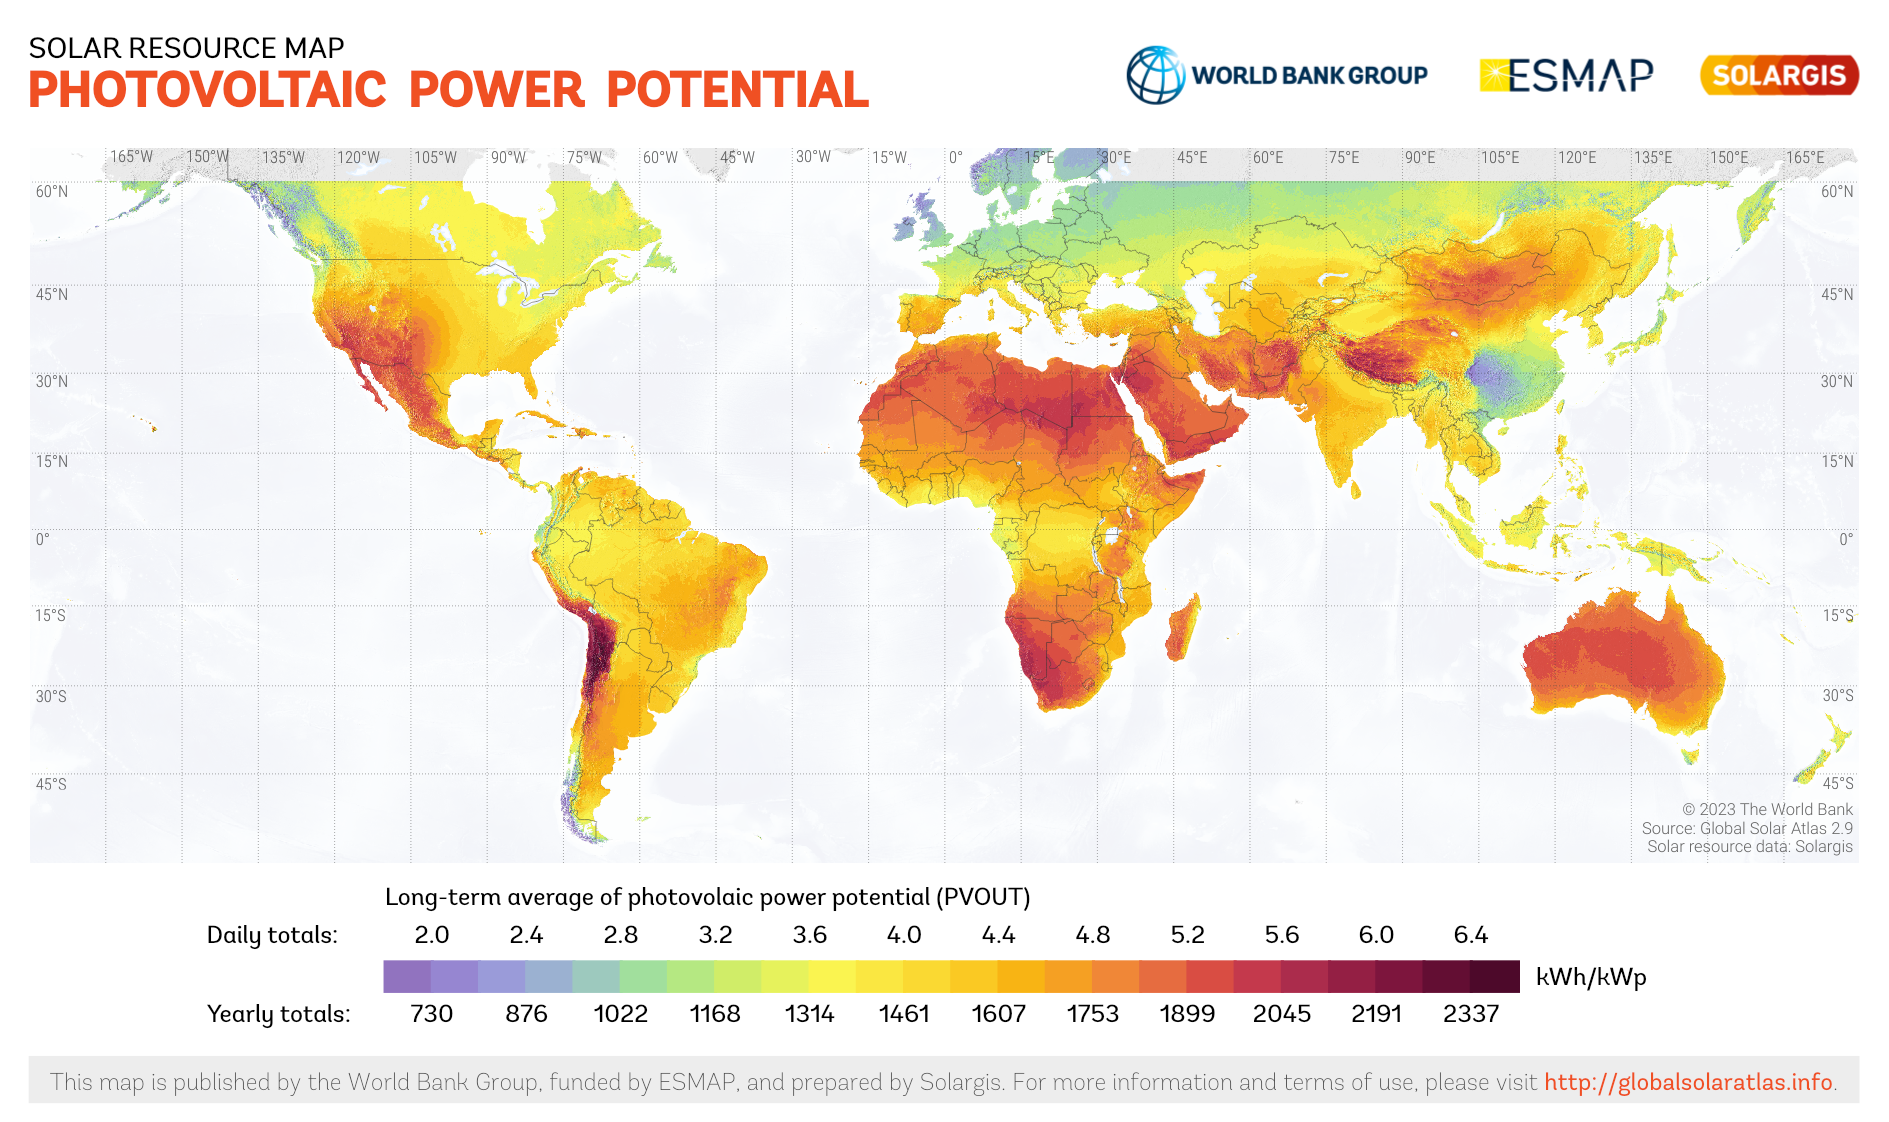
Solar irradiance
- Direct normal irradiance (DNI)
- Diffuse horizontal irradiance (DHI)
- Ground reflected irradiance (GRI)
- Global horizontal irradiance (GHI)
- Plane-of-array irradiance (POA)
GHI=DNI+DHI+GRI
POA = GHI \(\times \cos \theta\)
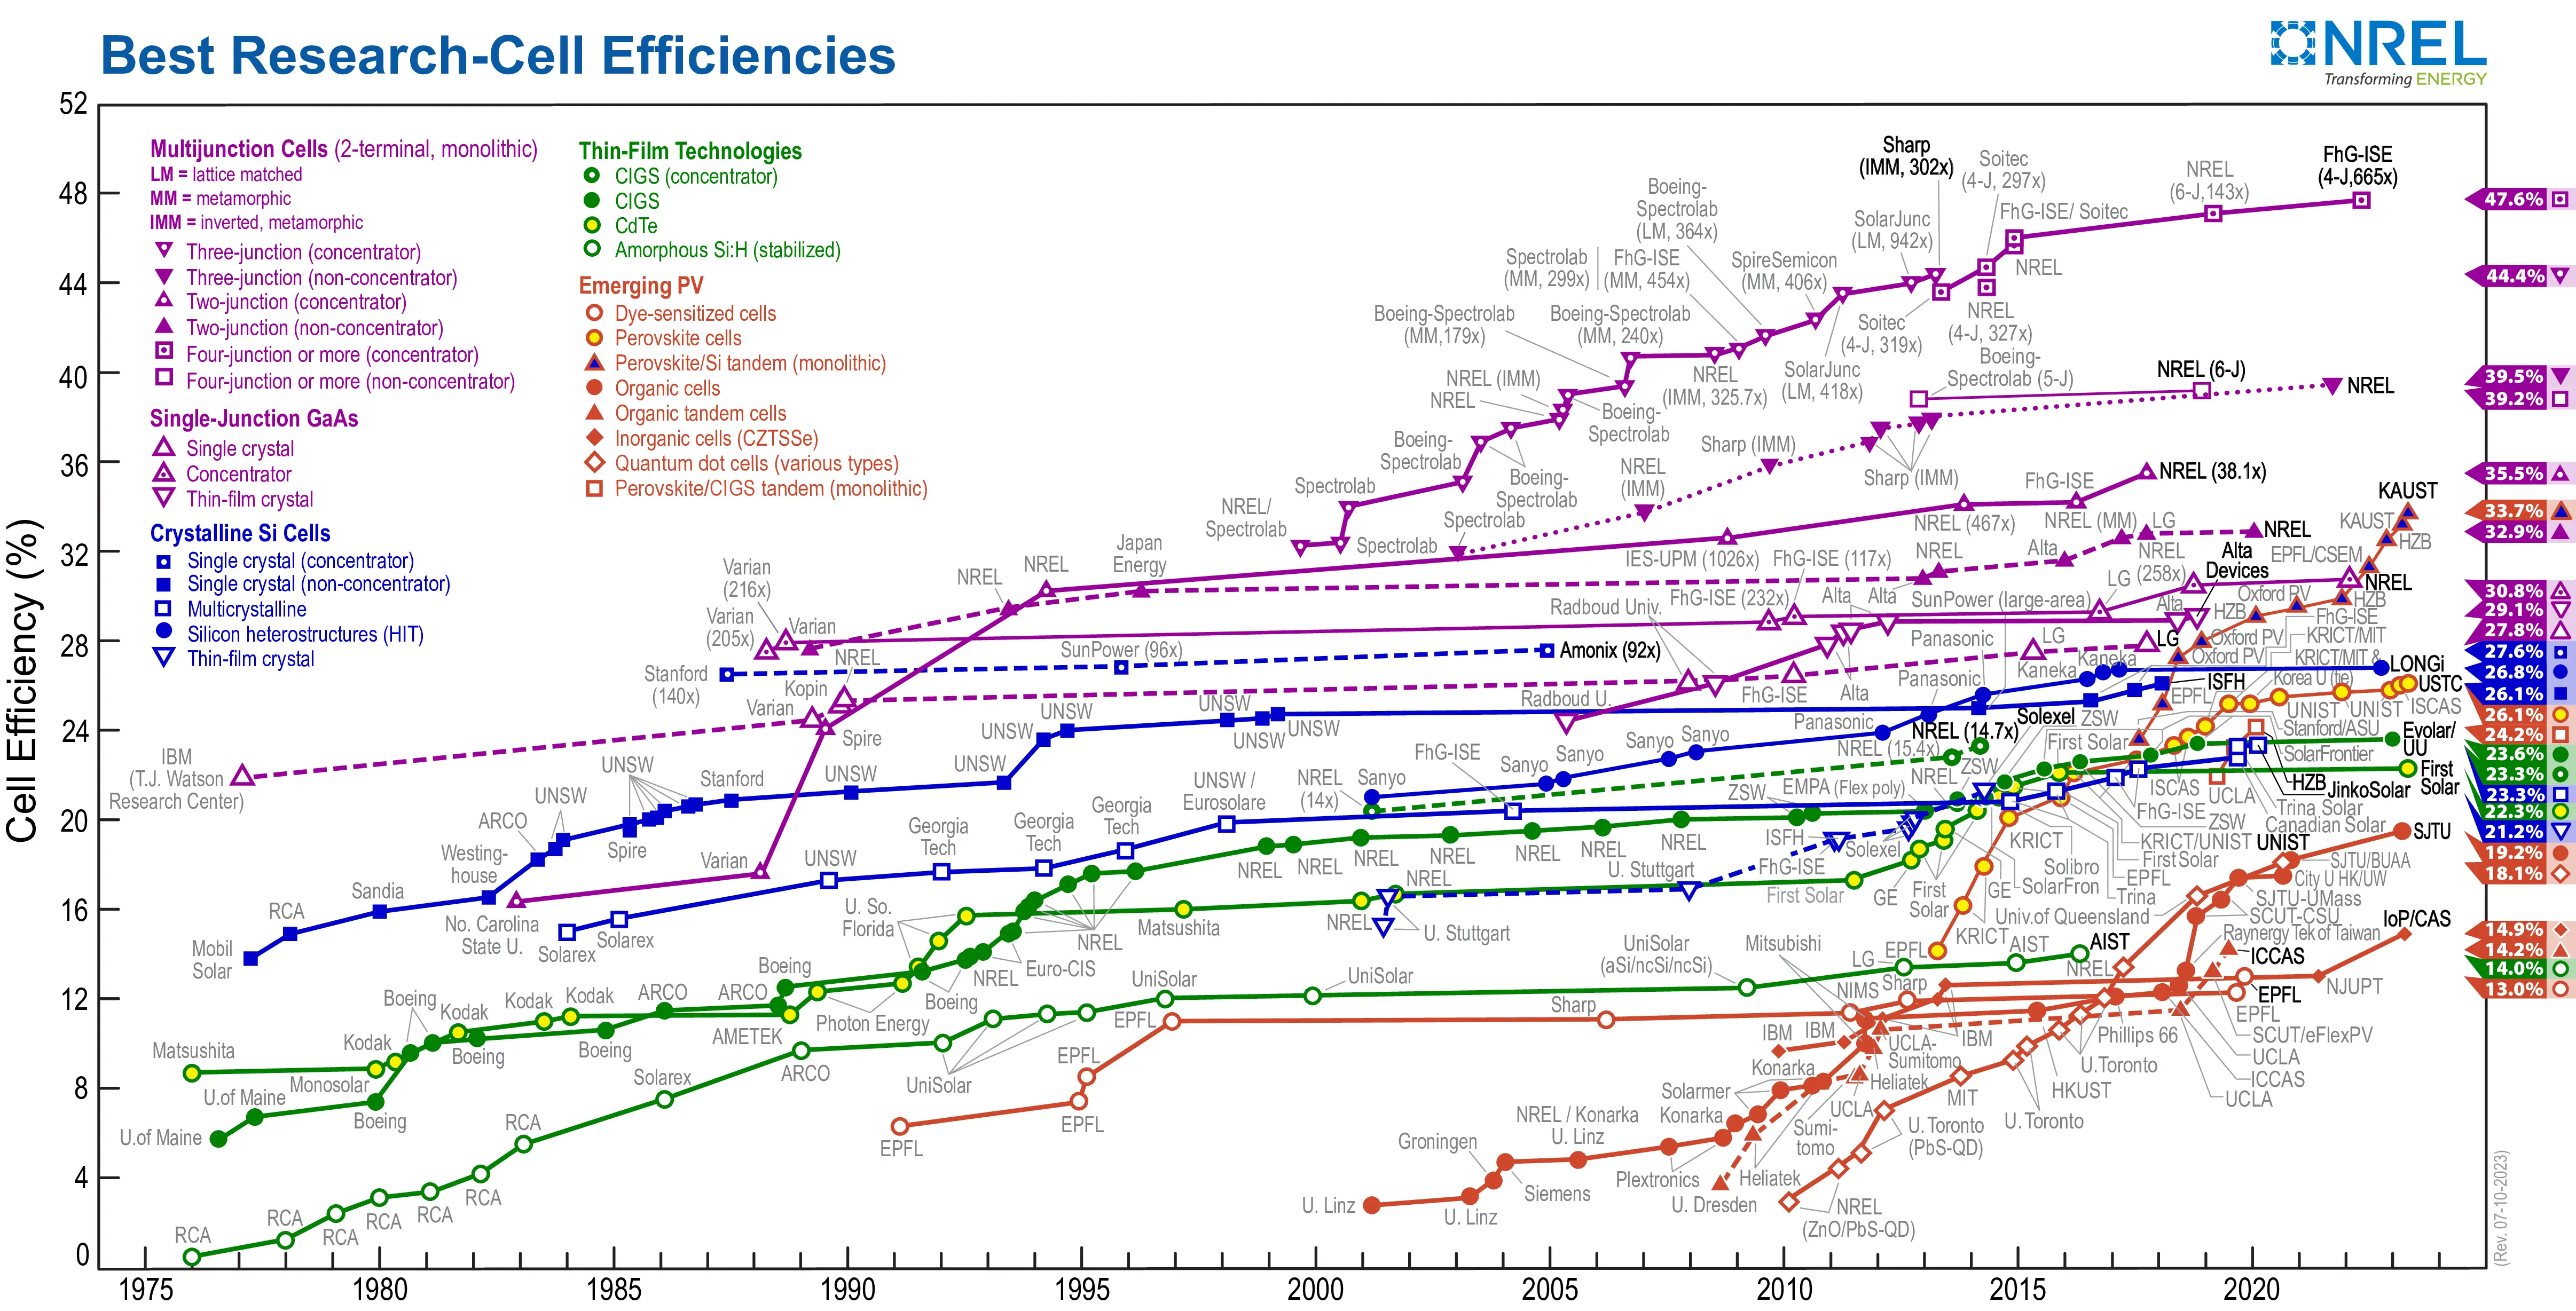
The quest for efficiency
Global and U.S. distribution
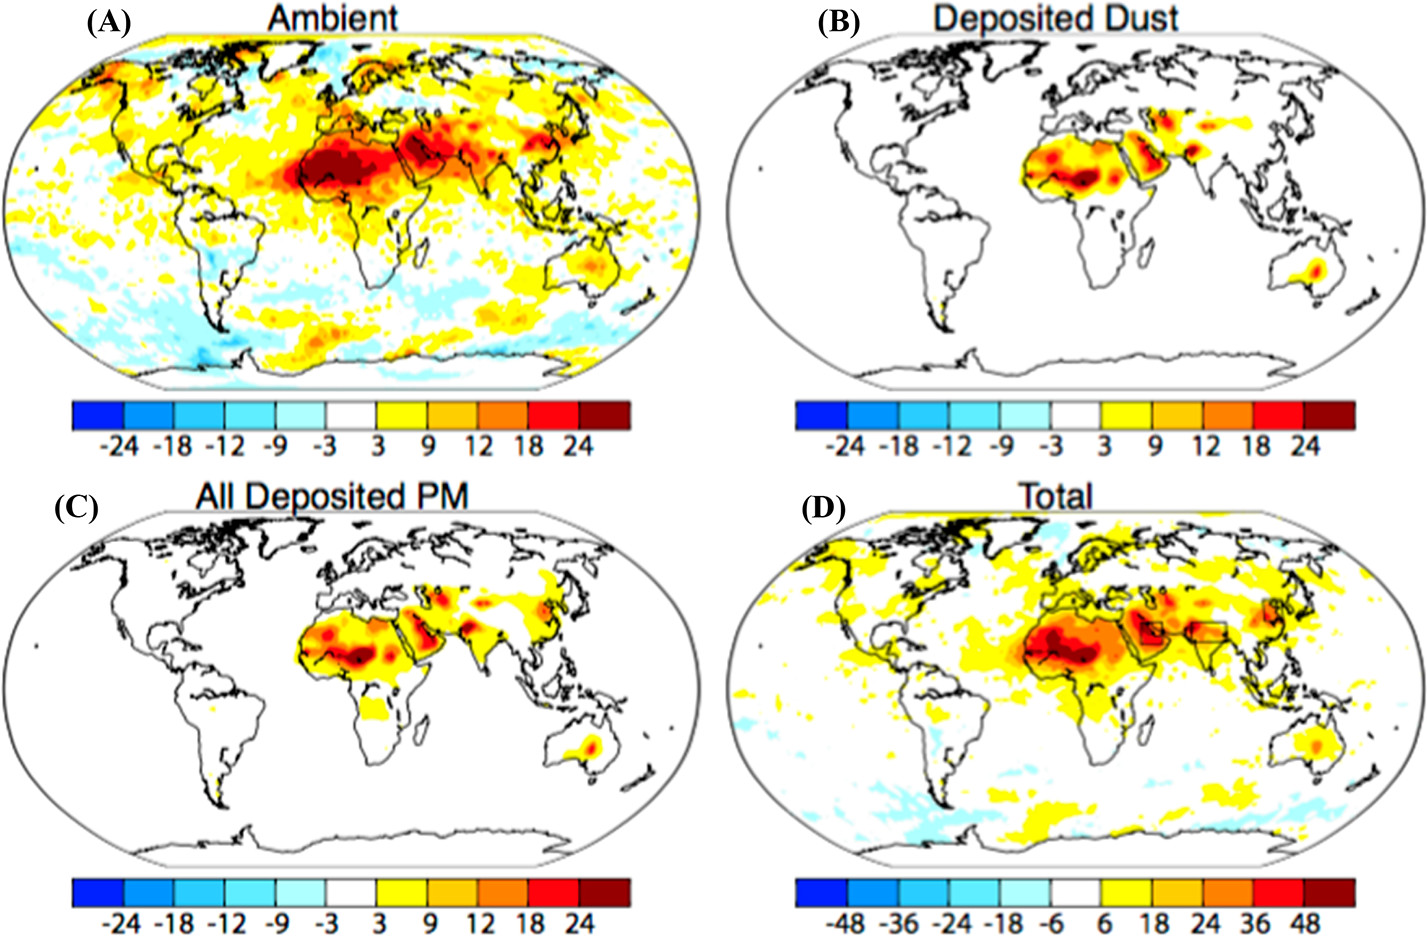
Air pollution and dust
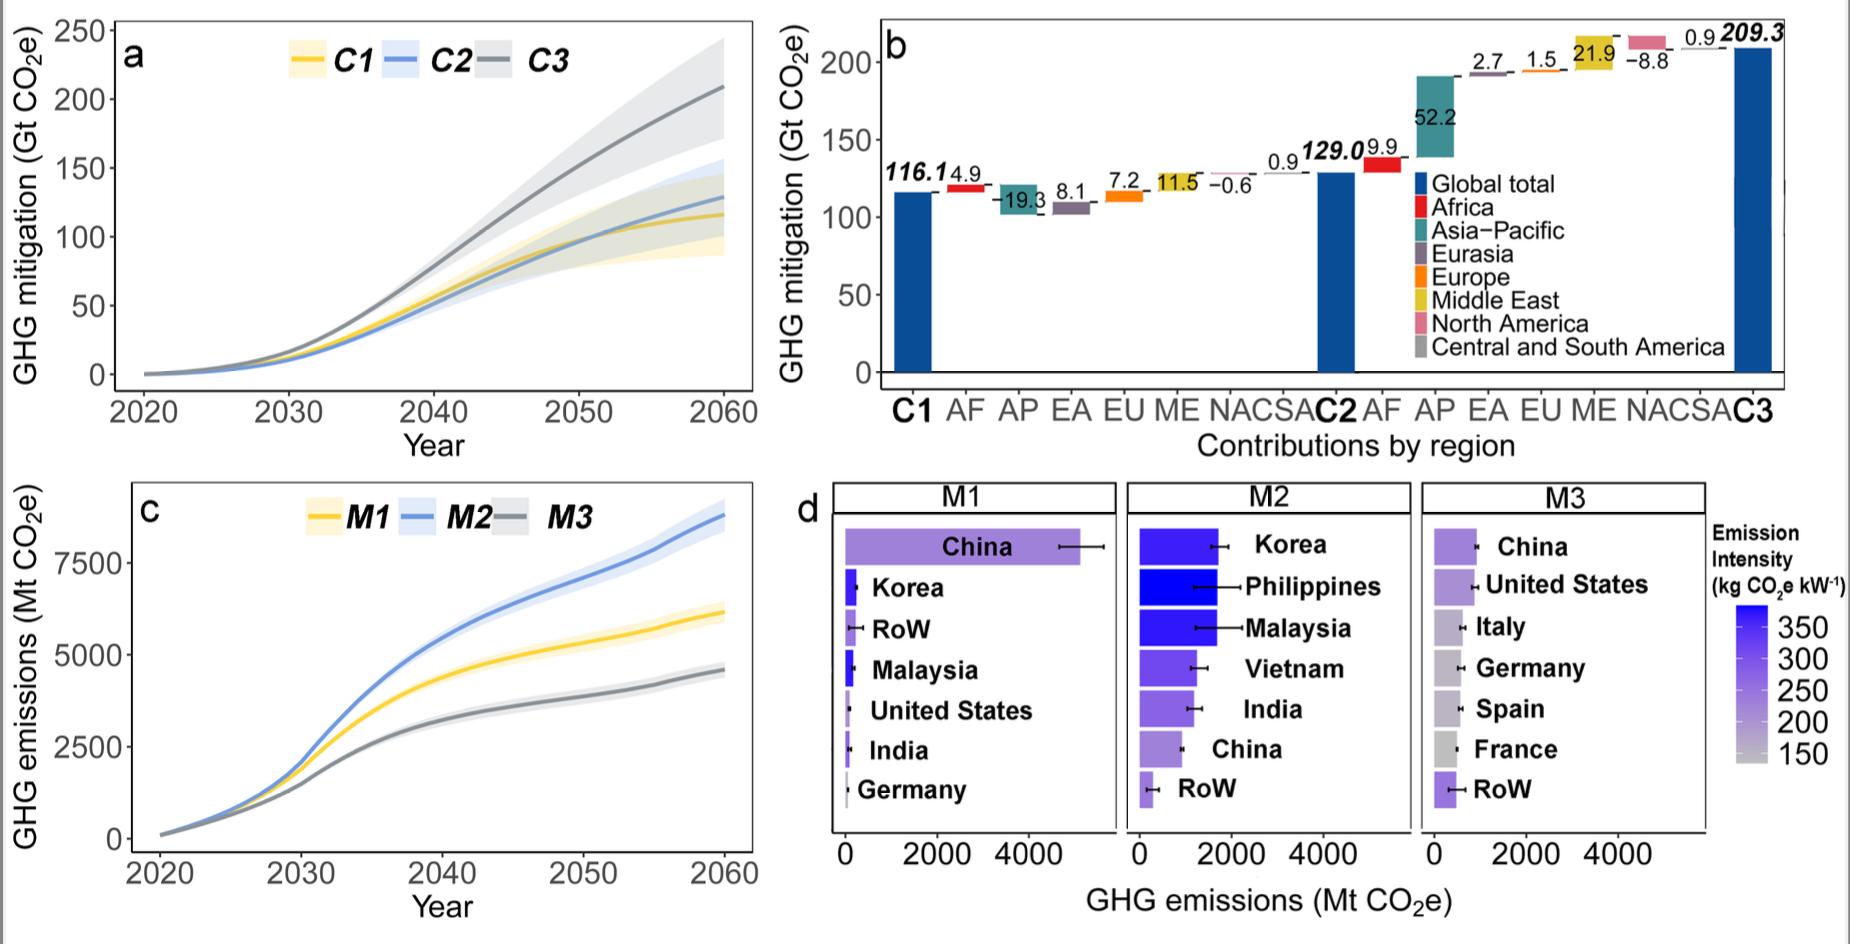
Prioritize solar installation
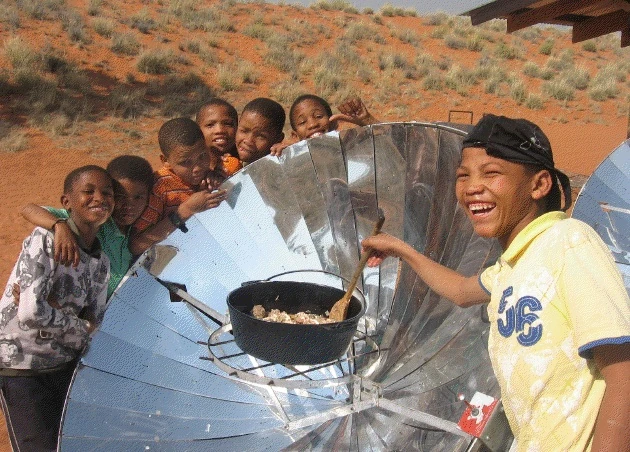
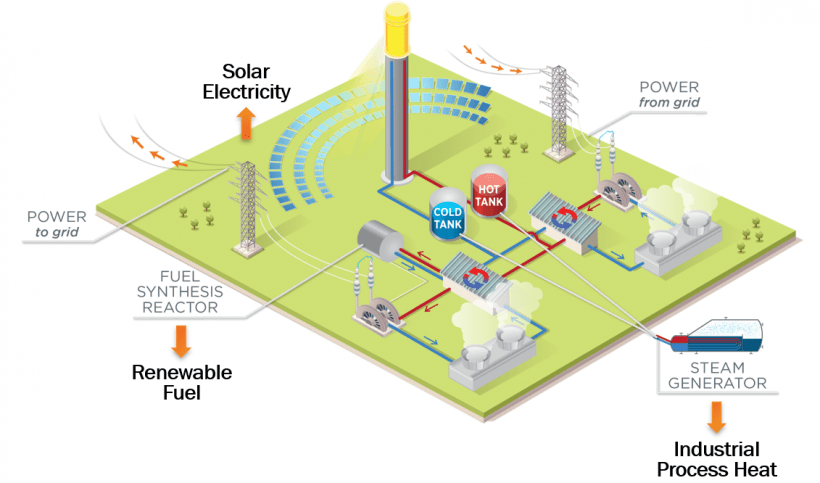
Solar thermal: CSP
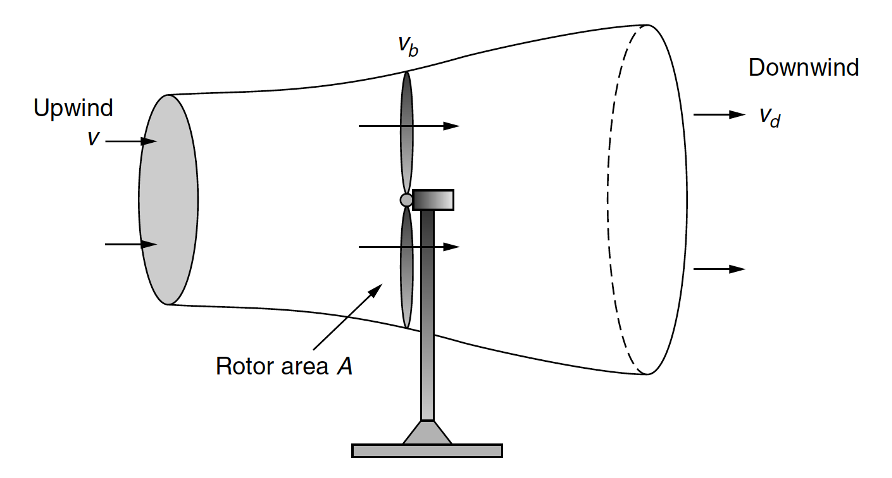
Wind

\(P=\frac{1}{2}\rho \pi r^2 v^3\)
Where,
\(\rho\) = Air Density (\(kg/m^3\))
\(A\) = Swept Area (\(m^2\)) = \(\pi r^2\)
\(v\) = Wind Speed (m/s)
\(P\) = Power (W)
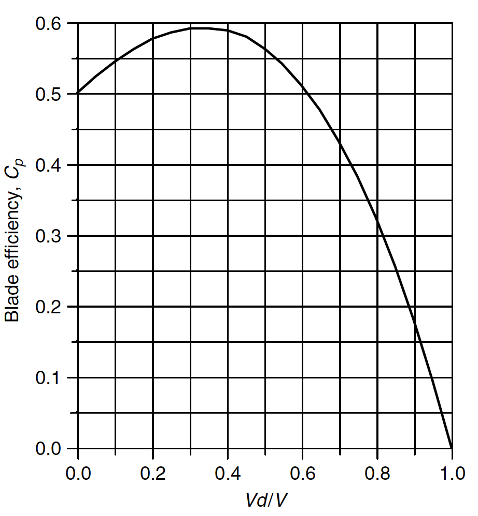
Betz’s law: 59.3%
Average power
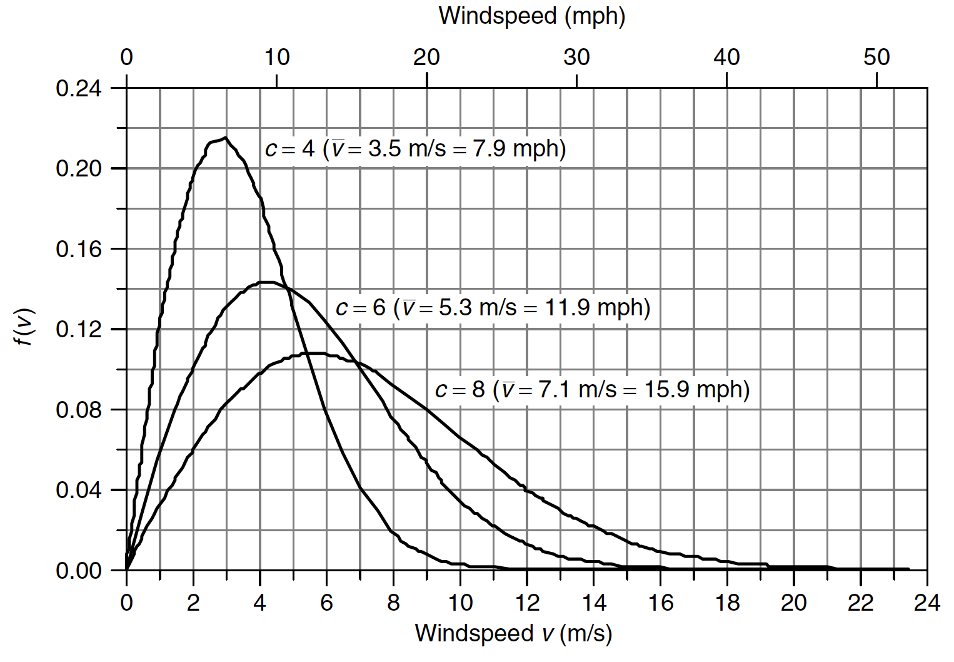
Rayleigh (a special type of Weibull) distribution
\(f(v)=\frac{2v}{c^2}\exp [-(\frac{v}{c})^2]\)
\(\bar{P}=\frac{6}{\pi}\cdot \frac{1}{2}\rho \pi r^2 (\bar{v})^3=1.91P\)
Use average power when dealing with average wind speed
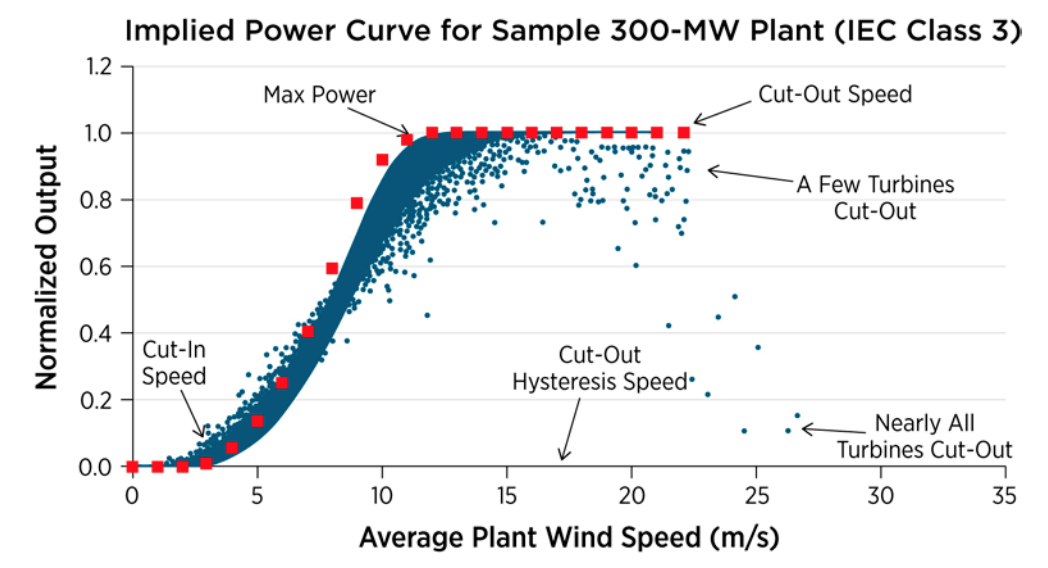
Power curve
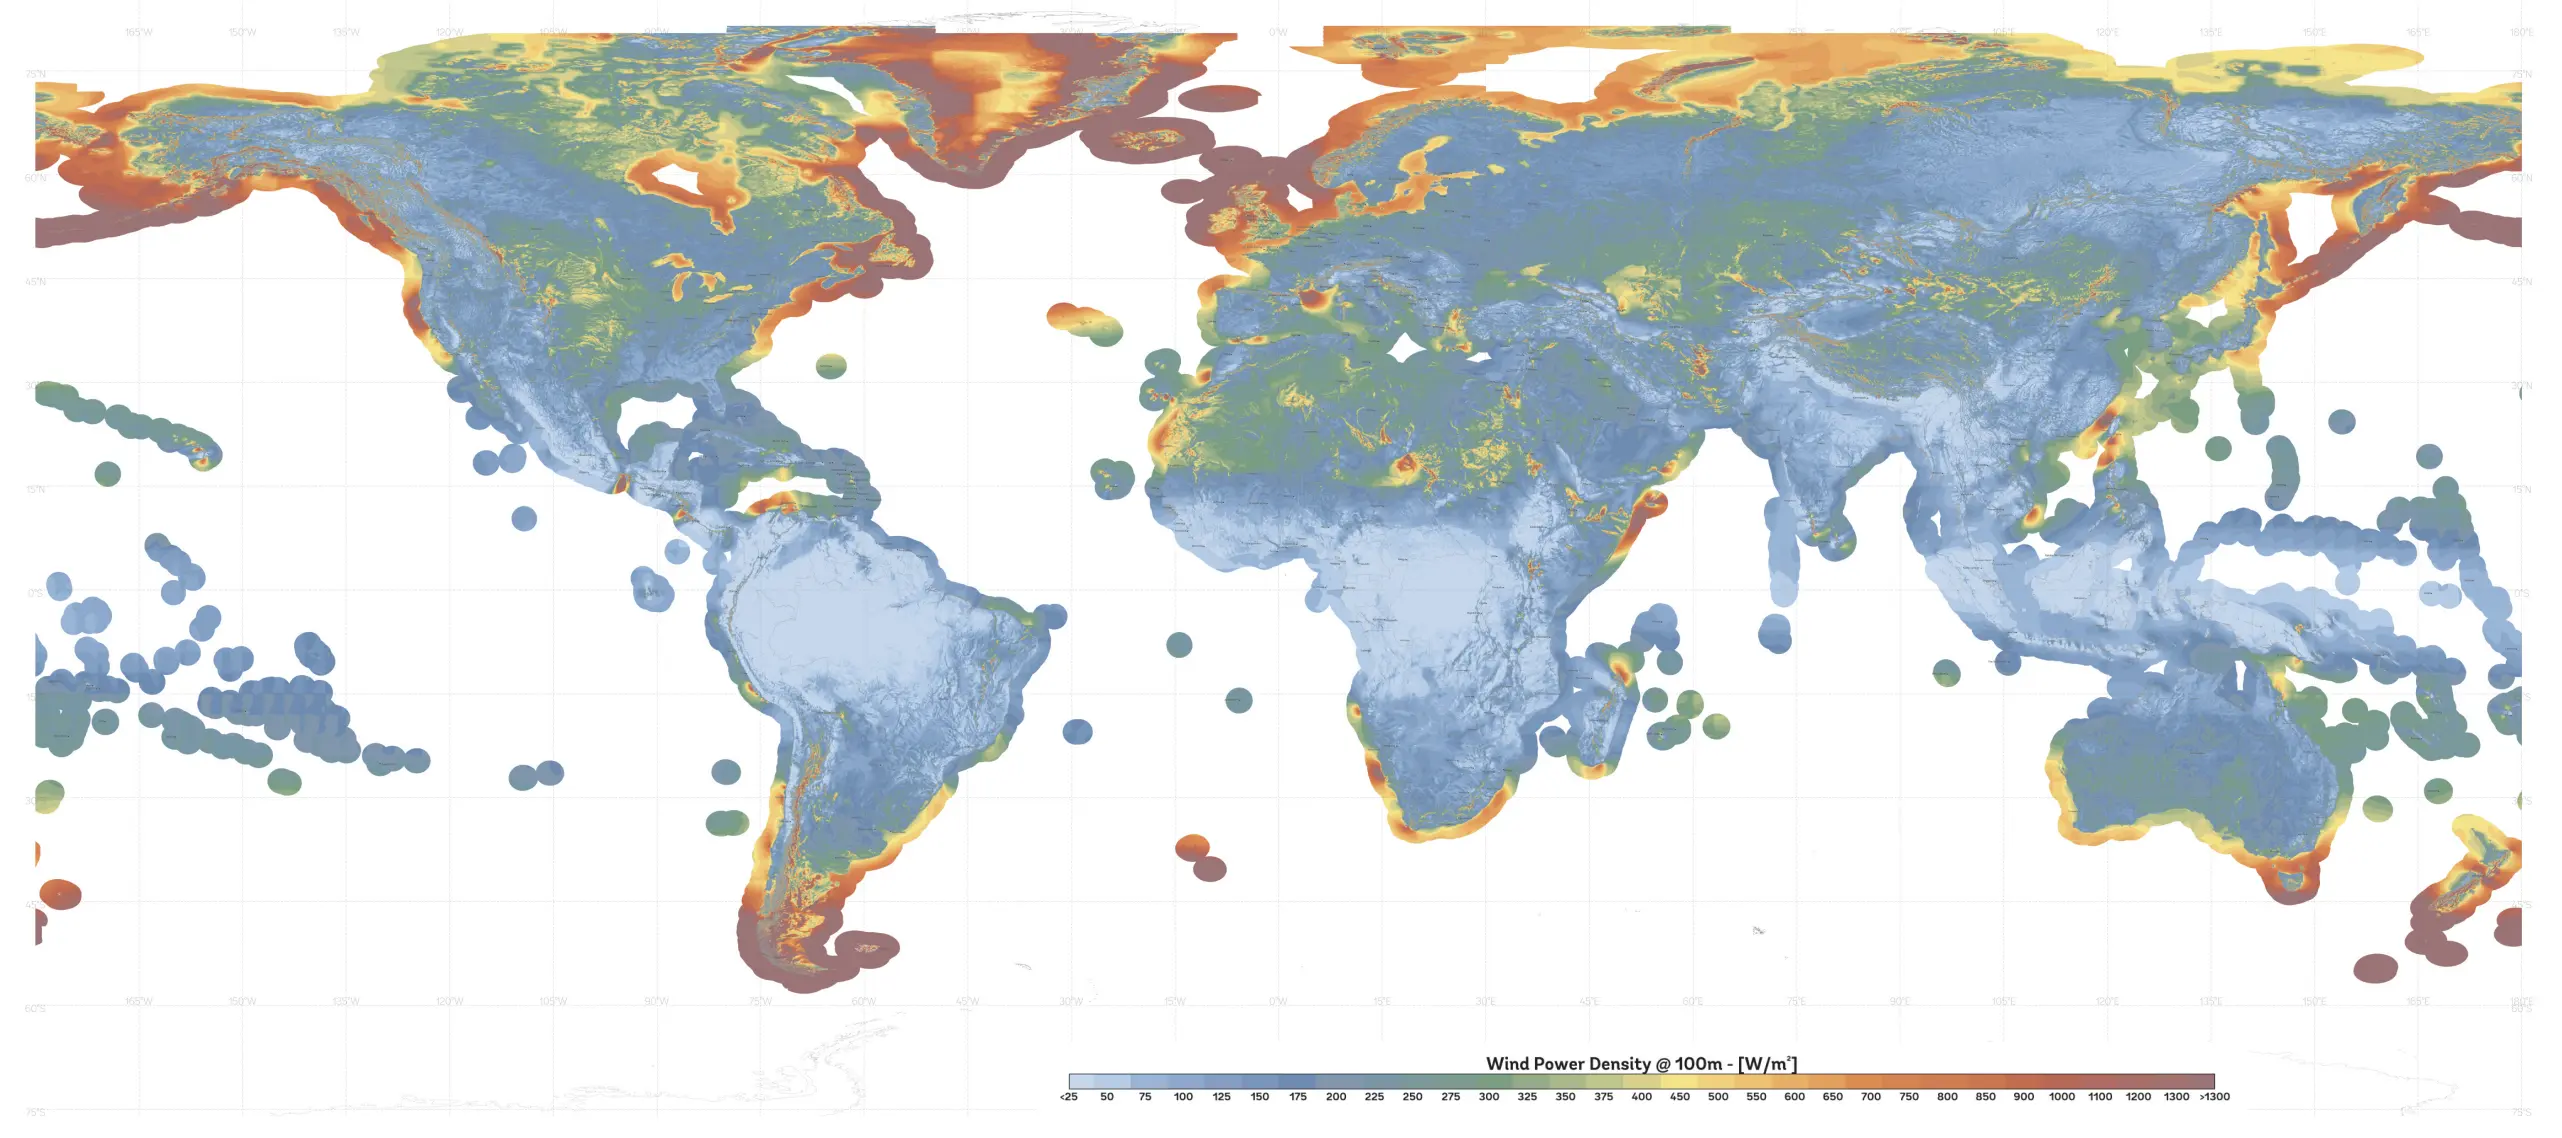
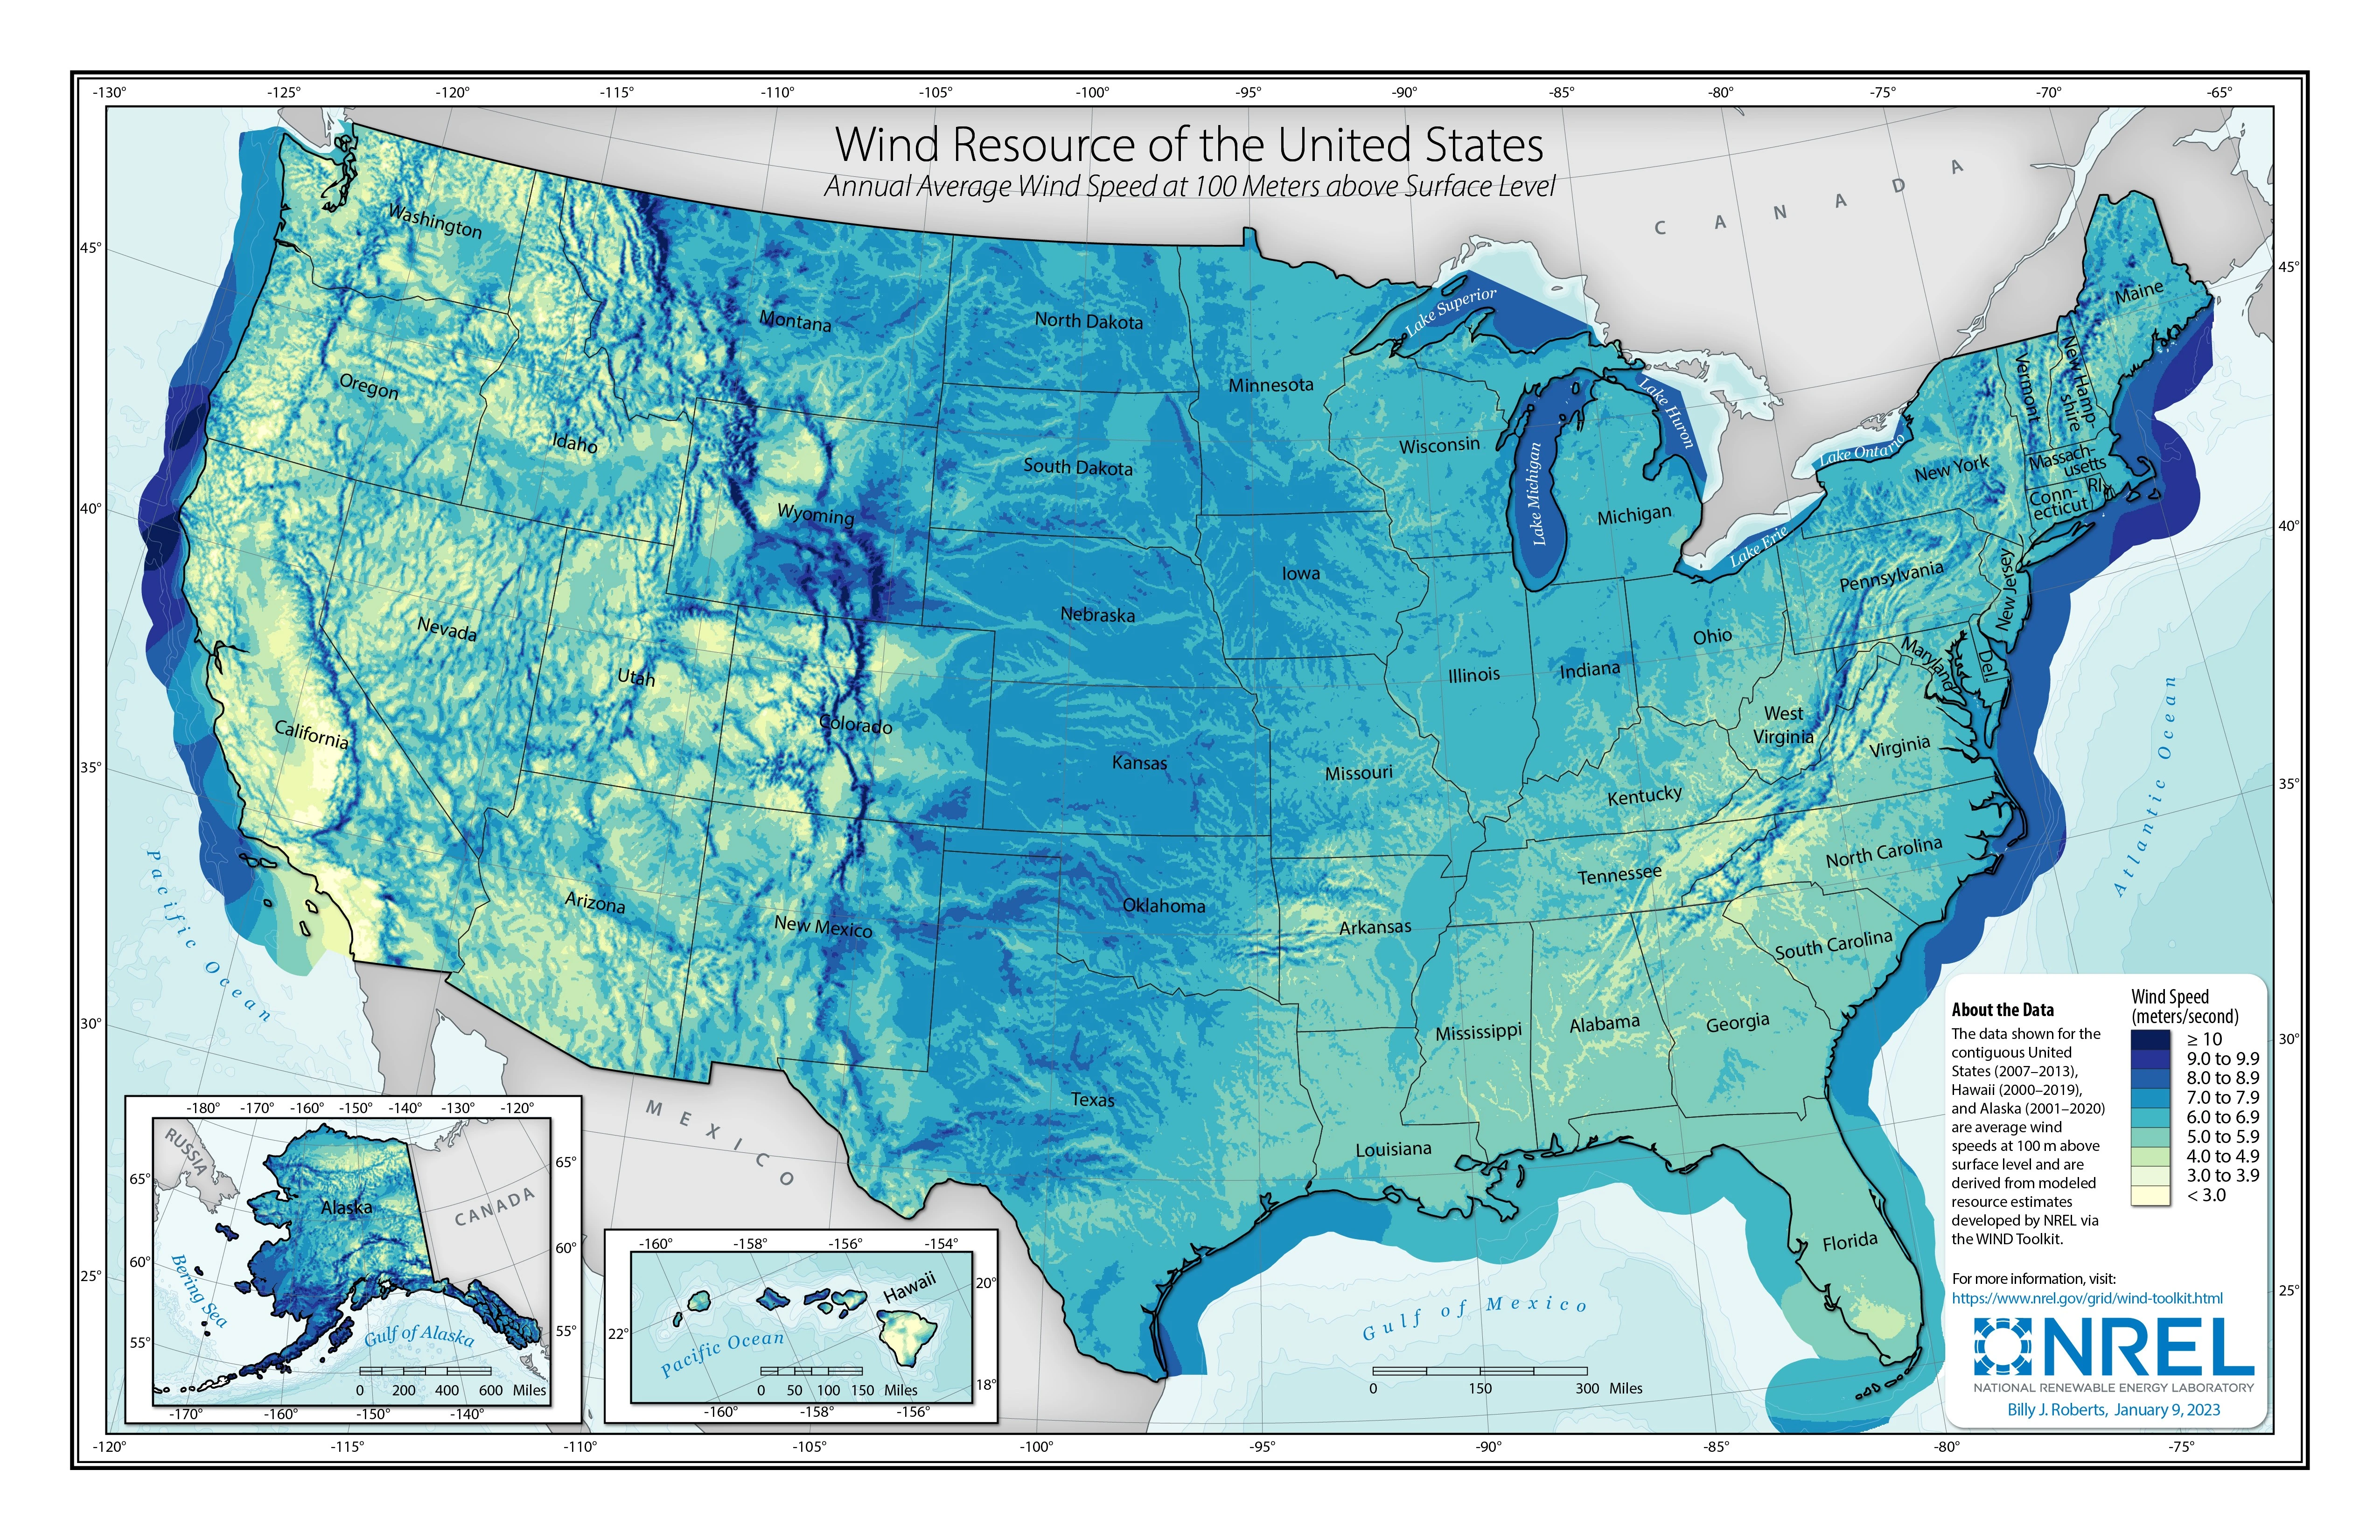
Global wind power density map
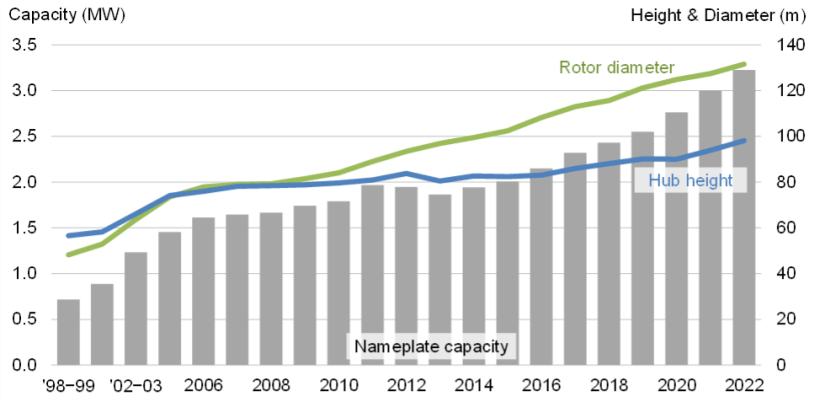
Higher and bigger
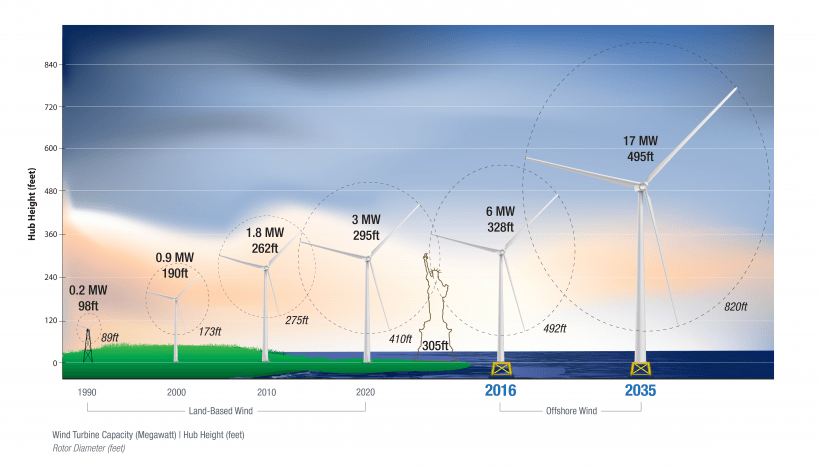
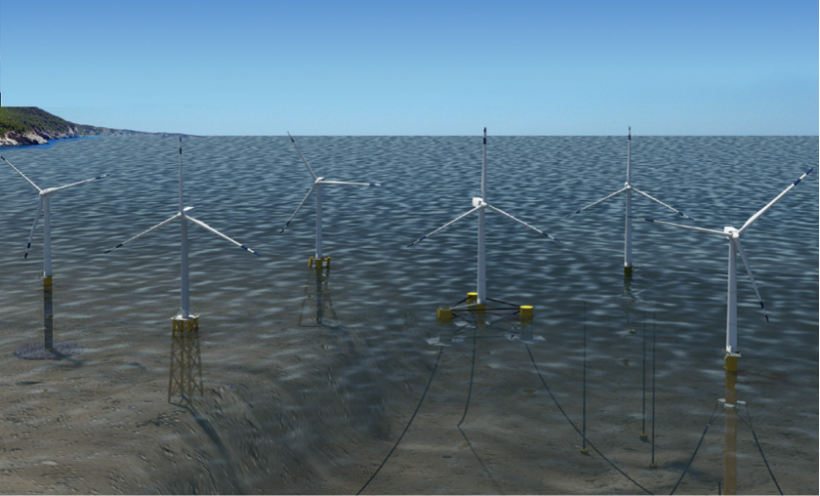
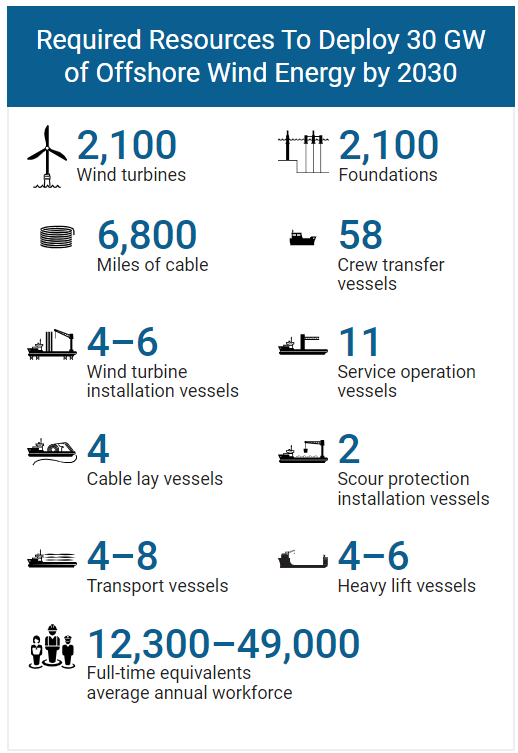
Offshore wind
Challenges
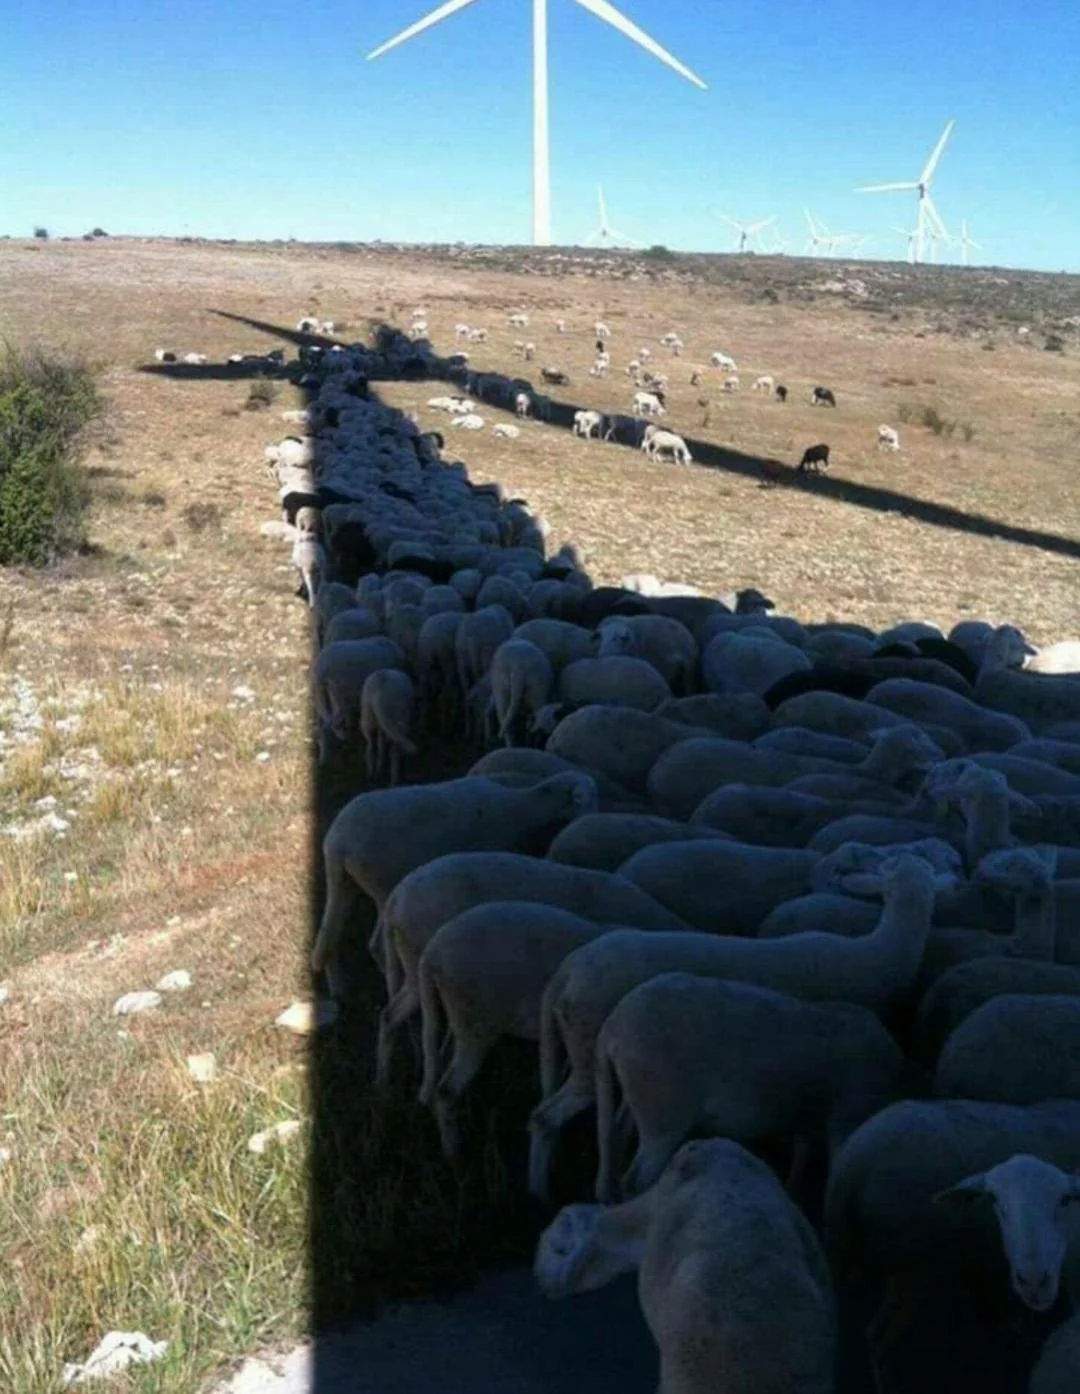
Unexpected benefits
Climate change impact

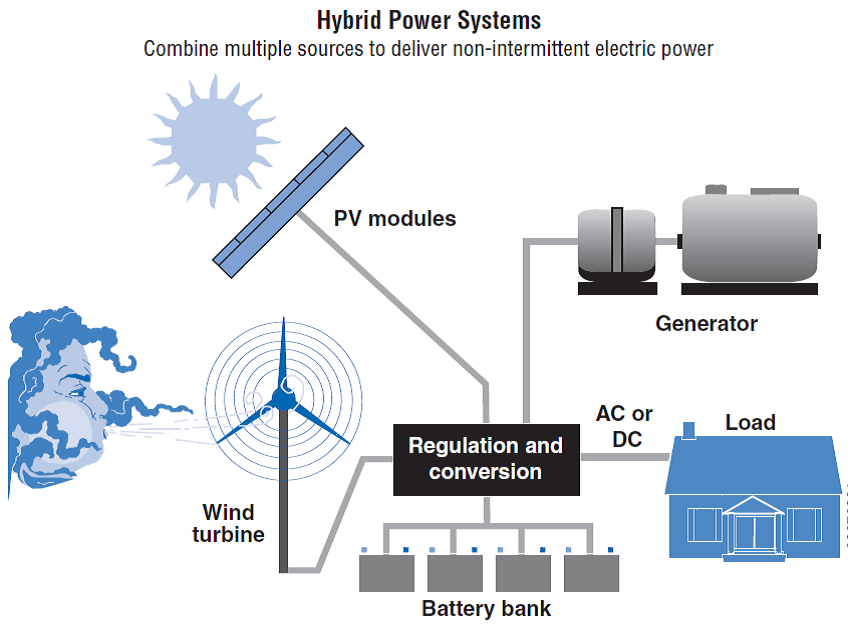
Hybrid power systems