Lecture 11 Energy Technologies: Wind
October 5, 2023
Sun, the source
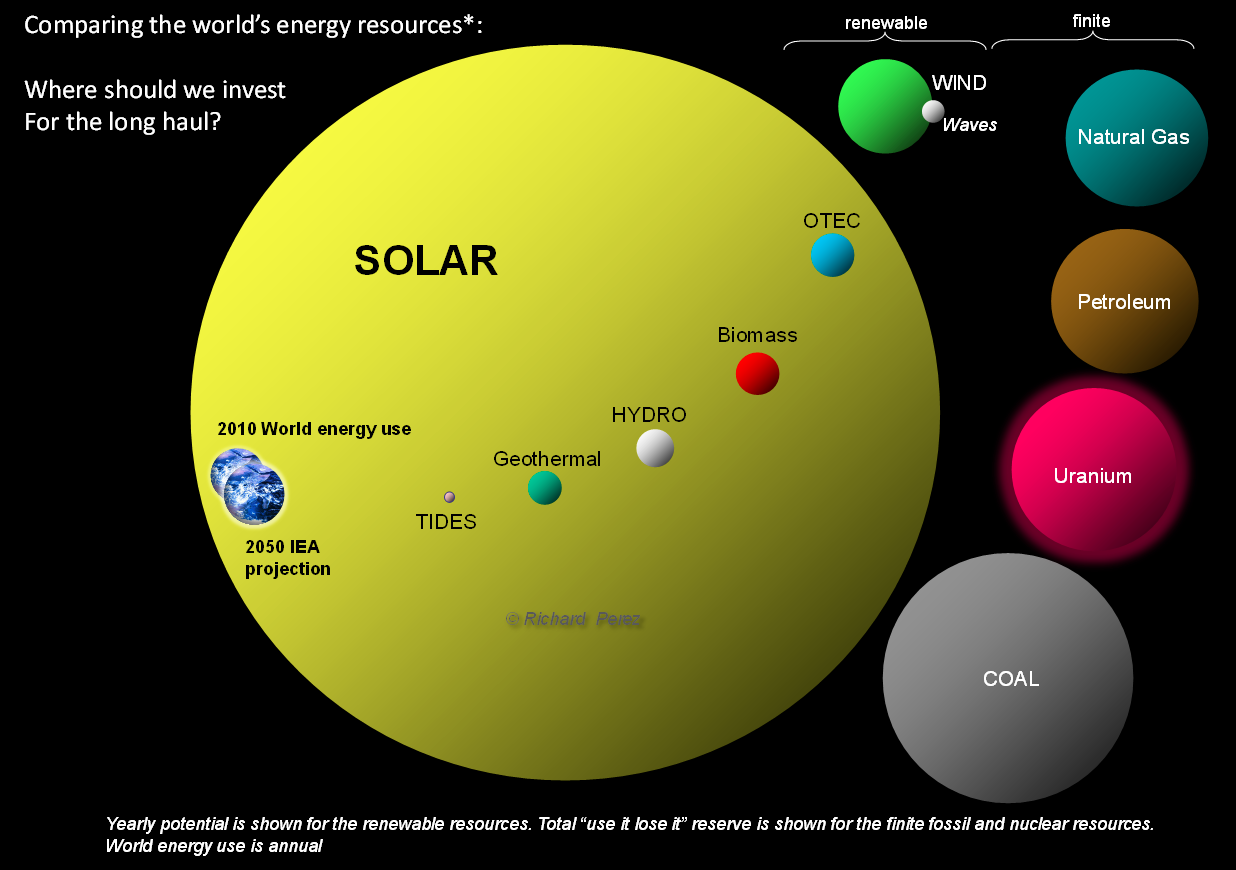
Source: Richard Perez
Wind
\(P=\frac{1}{2}\rho \pi r^2 v^3\)
Where,
\(\rho\) = Air Density (\(kg/m^3\))
\(A\) = Swept Area (m2) = \(\pi r^2\)
\(v\) = Wind Speed (m/s)
\(P\) = Power (W)
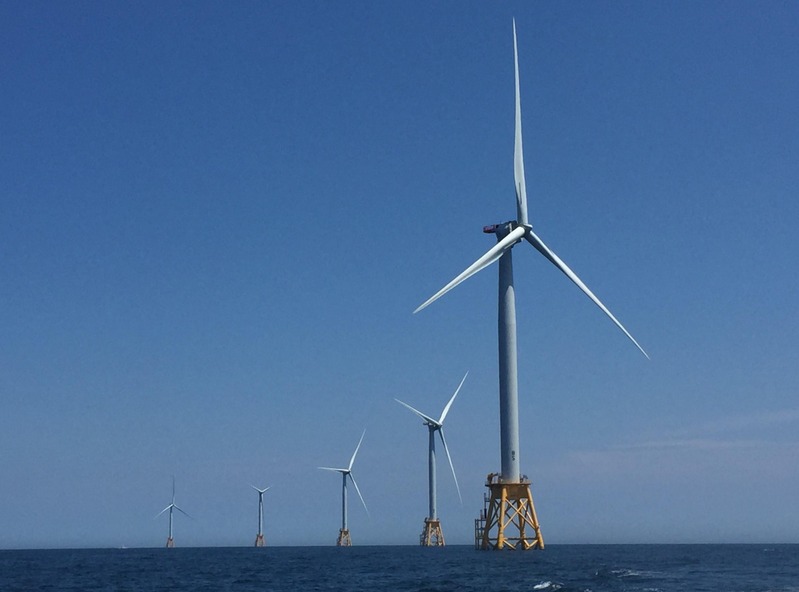
Photo by Gang He, Block Island Offshore Wind Farm
Betz’s law: 59.3%
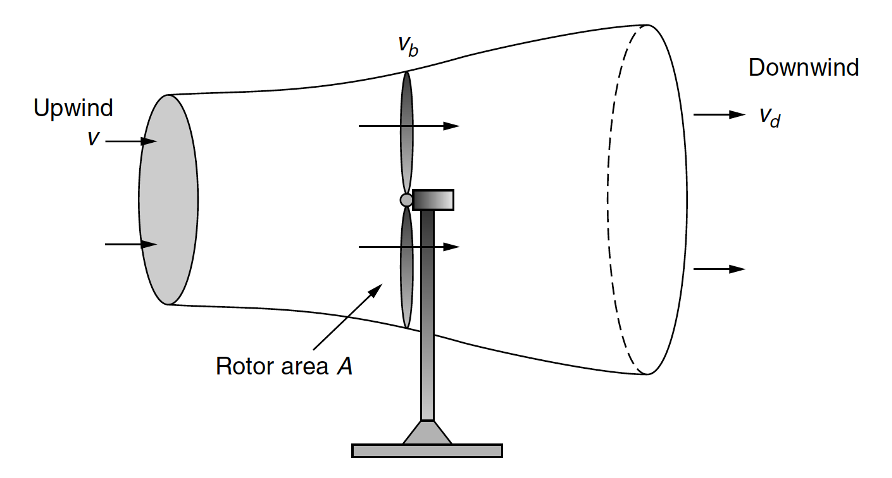
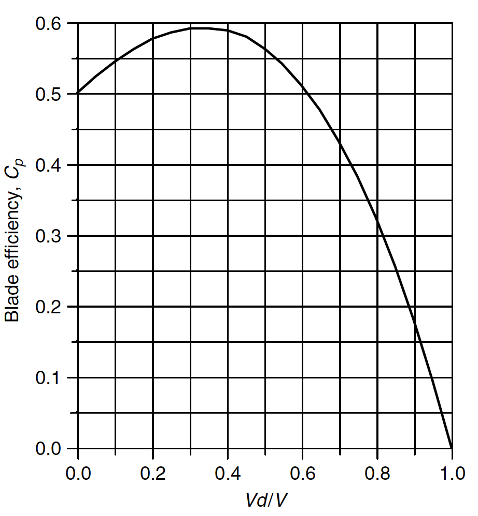
Source: Masters (2013)
Average power
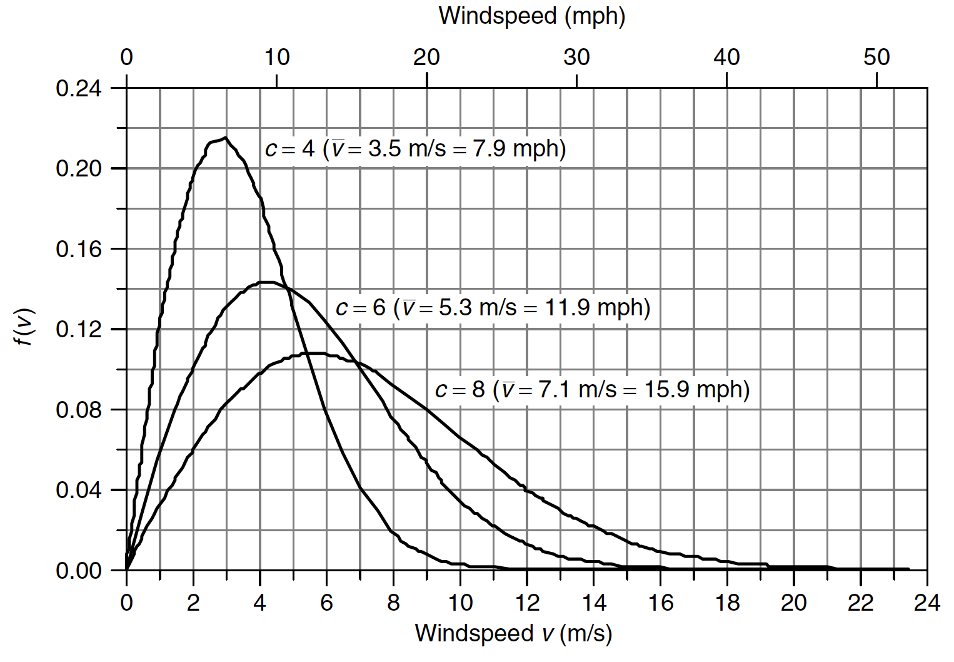
Rayleigh (a special type of Weibull) distribution
\(f(v)=\frac{2v}{c^2}\exp [-(\frac{v}{c})^2]\)
\(\bar{P}=\frac{6}{\pi}\cdot \frac{1}{2}\rho \pi r^2 (\bar{v})^3=1.91P\)
Use average power when dealing with average wind speed
Read more: Masters (2013)
Power curve
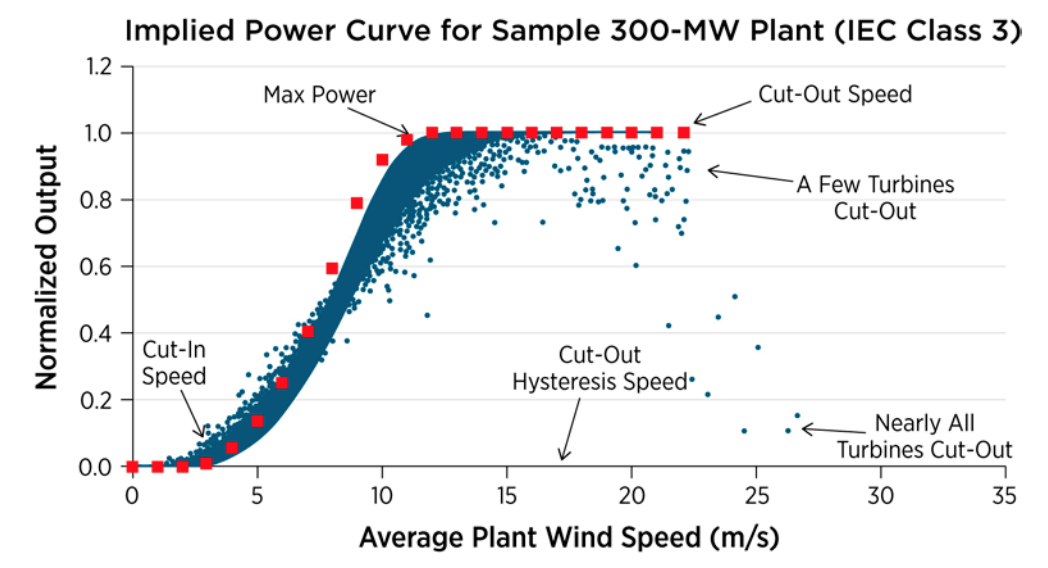
Read more: NREL, Validation of Power Output for the WIND Toolkit
Important corrections
- Temperature: \(\rho = \frac{P\times M.W. \times 10^{-3}}{RT}=\frac{1 atm\times 28.97 g/mol \times 10^{-3}kg/g}{8.2056\times 10^{-5}m^3\cdot atm/(K\cdot mol)\times(273.15+T)K}\)
- Altitude: \(P=P_0 e^{-1.185\times 10^{-4}H}\) (H is elevation in meters)
- Tower height: \(\frac{v}{v_0}=(\frac{H}{H_0})^\alpha\) (\(\alpha\) is the friction coefficient)
Read more: Masters (2013)
Class of wind resources
| Class | 10 m (33 ft) | 50 m (164 ft) | ||
|---|---|---|---|---|
| Wind power density (W/m2) | Speed m/s (mph) | Wind power density (W/m2) | Speed m/s (mph) | |
| 1 | 0 - 100 | 0 - 4.4 (0 - 9.8) | 0 - 200 | 0 - 5.6 (0 - 12.5) |
| 2 | 100 - 150 | 4.4 - 5.1 (9.8 - 11.5) | 200 - 300 | 5.6 - 6.4 (12.5 - 14.3) |
| 3 | 150 - 200 | 5.1 - 5.6 (11.5 - 12.5) | 300 - 400 | 6.4 - 7.0 (14.3 - 15.7) |
| 4 | 200 - 250 | 5.6 - 6.0 (12.5 - 13.4) | 400 - 500 | 7.0 - 7.5 (15.7 - 16.8) |
| 5 | 250 - 300 | 6.0 - 6.4 (13.4 - 14.3) | 500 - 600 | 7.5 - 8.0 (16.8 - 17.9) |
| 6 | 300 - 400 | 6.4 - 7.0 (14.3 - 15.7) | 600 - 800 | 8.0 - 8.8 (17.9 - 19.7) |
| 7 | 400 - 1000 | 7.0 - 9.4 (15.7 - 21.1) | 800 - 2000 | 8.8 - 11.9 (19.7 - 26.6) |
Source: NREL
Global wind power density map
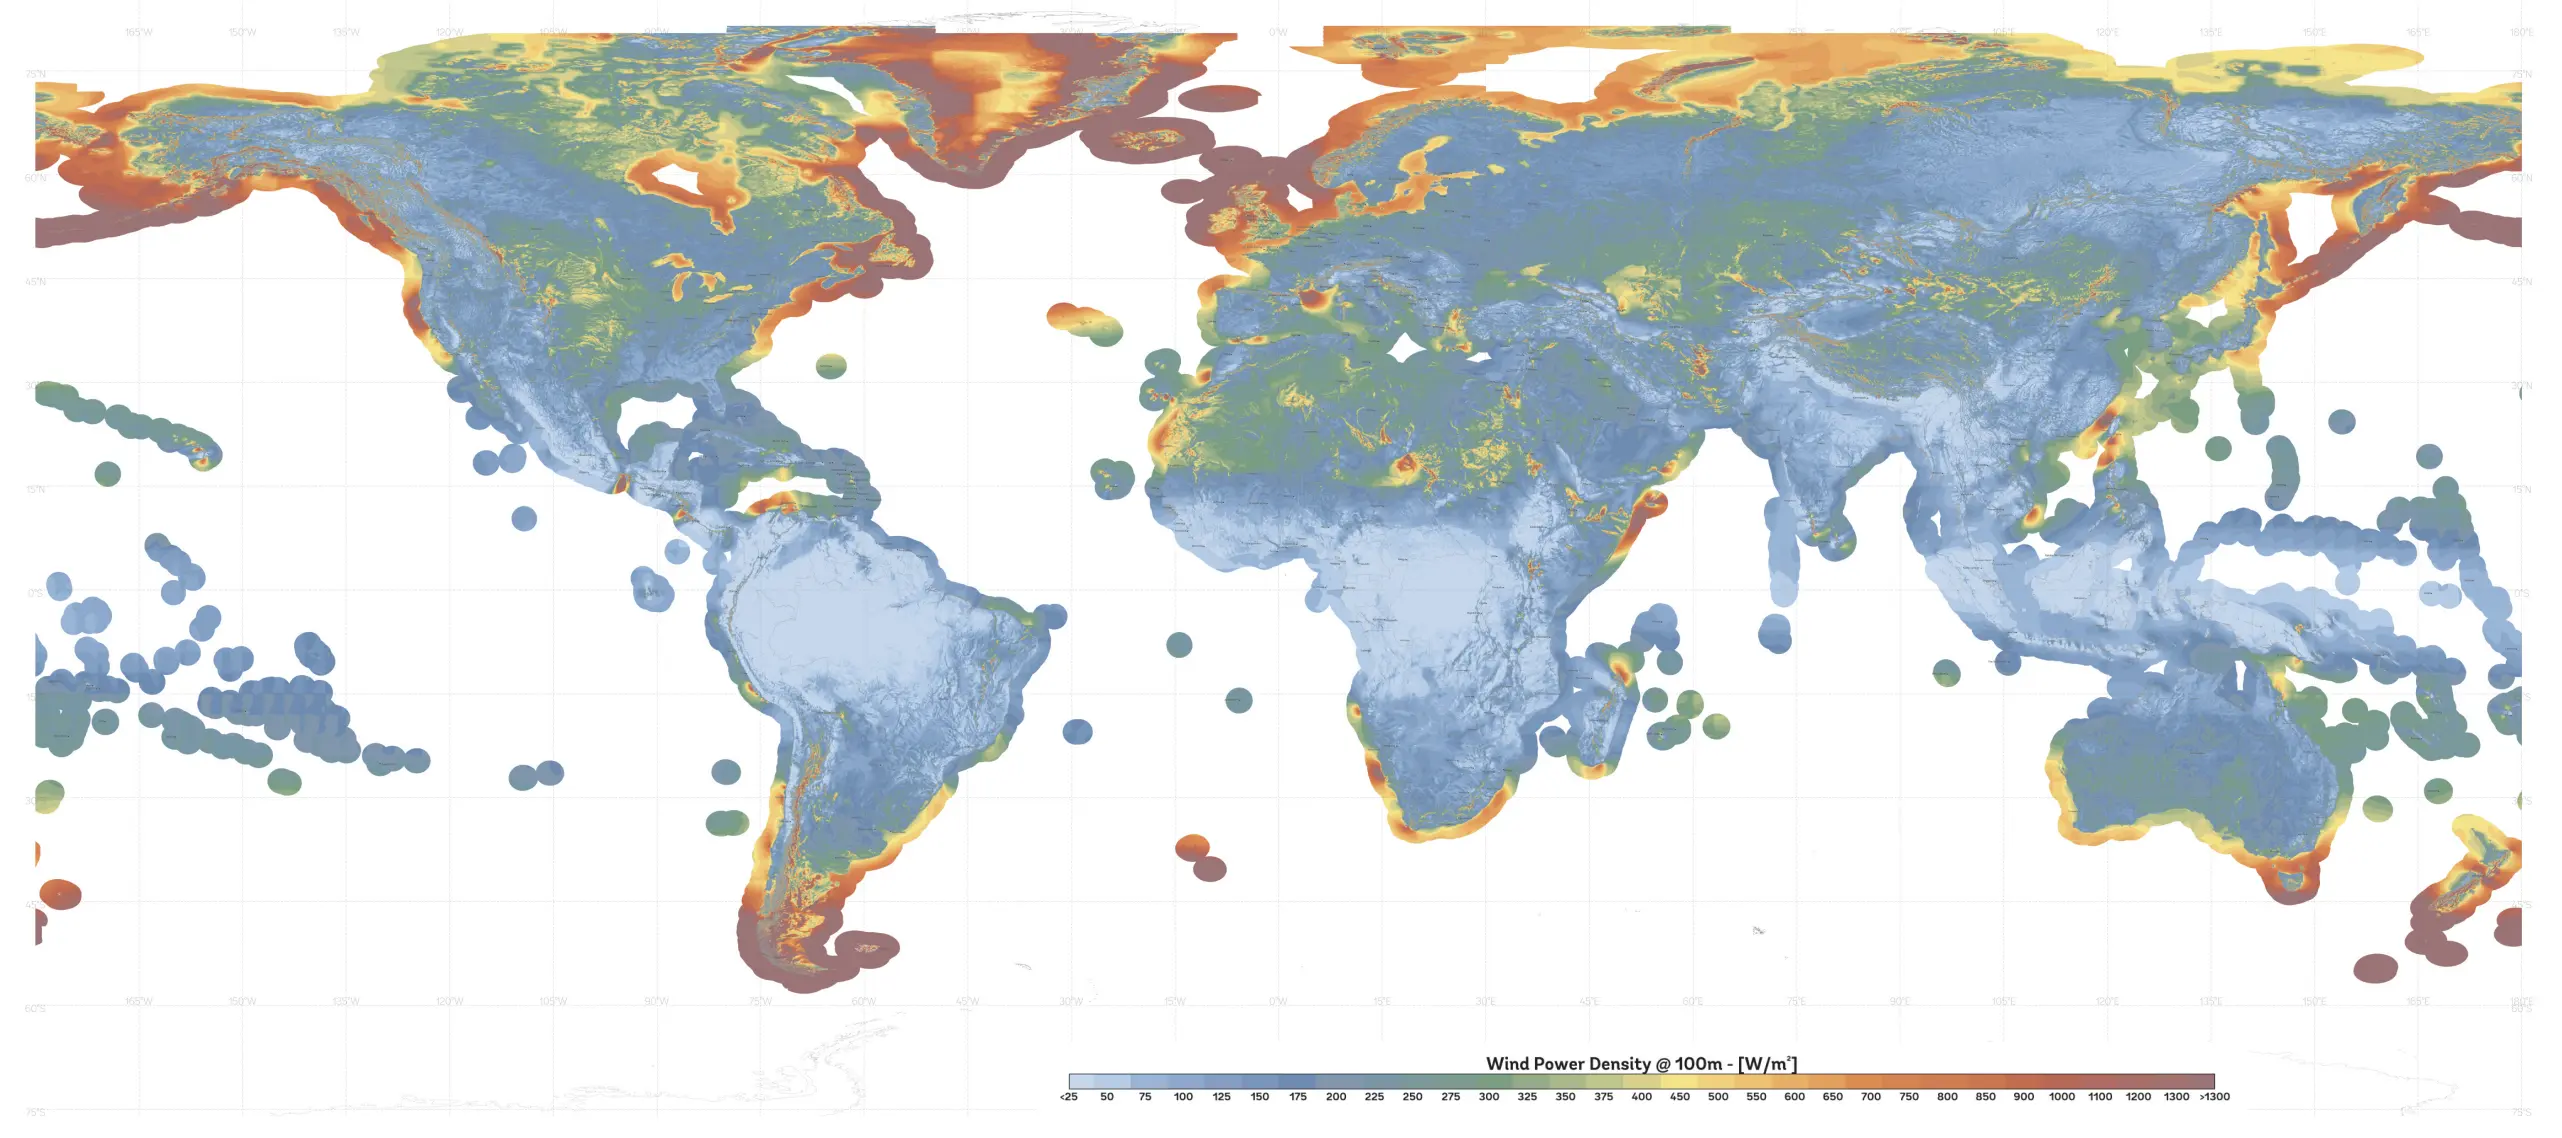
Source: Global Wind Atlas
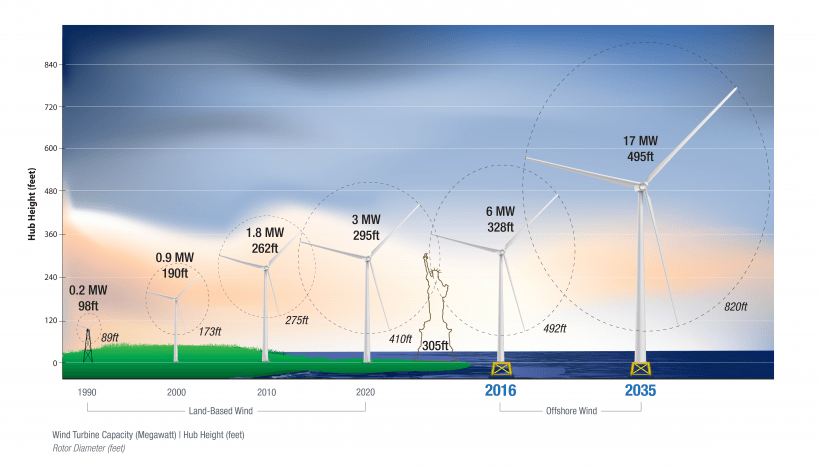
Higher and bigger
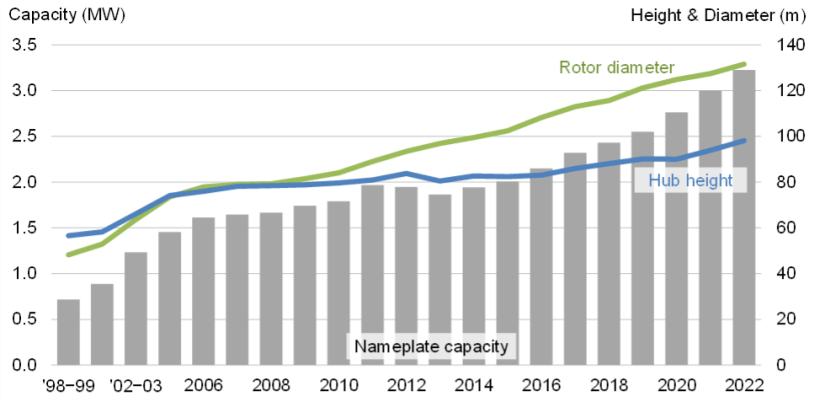
Offshore wind
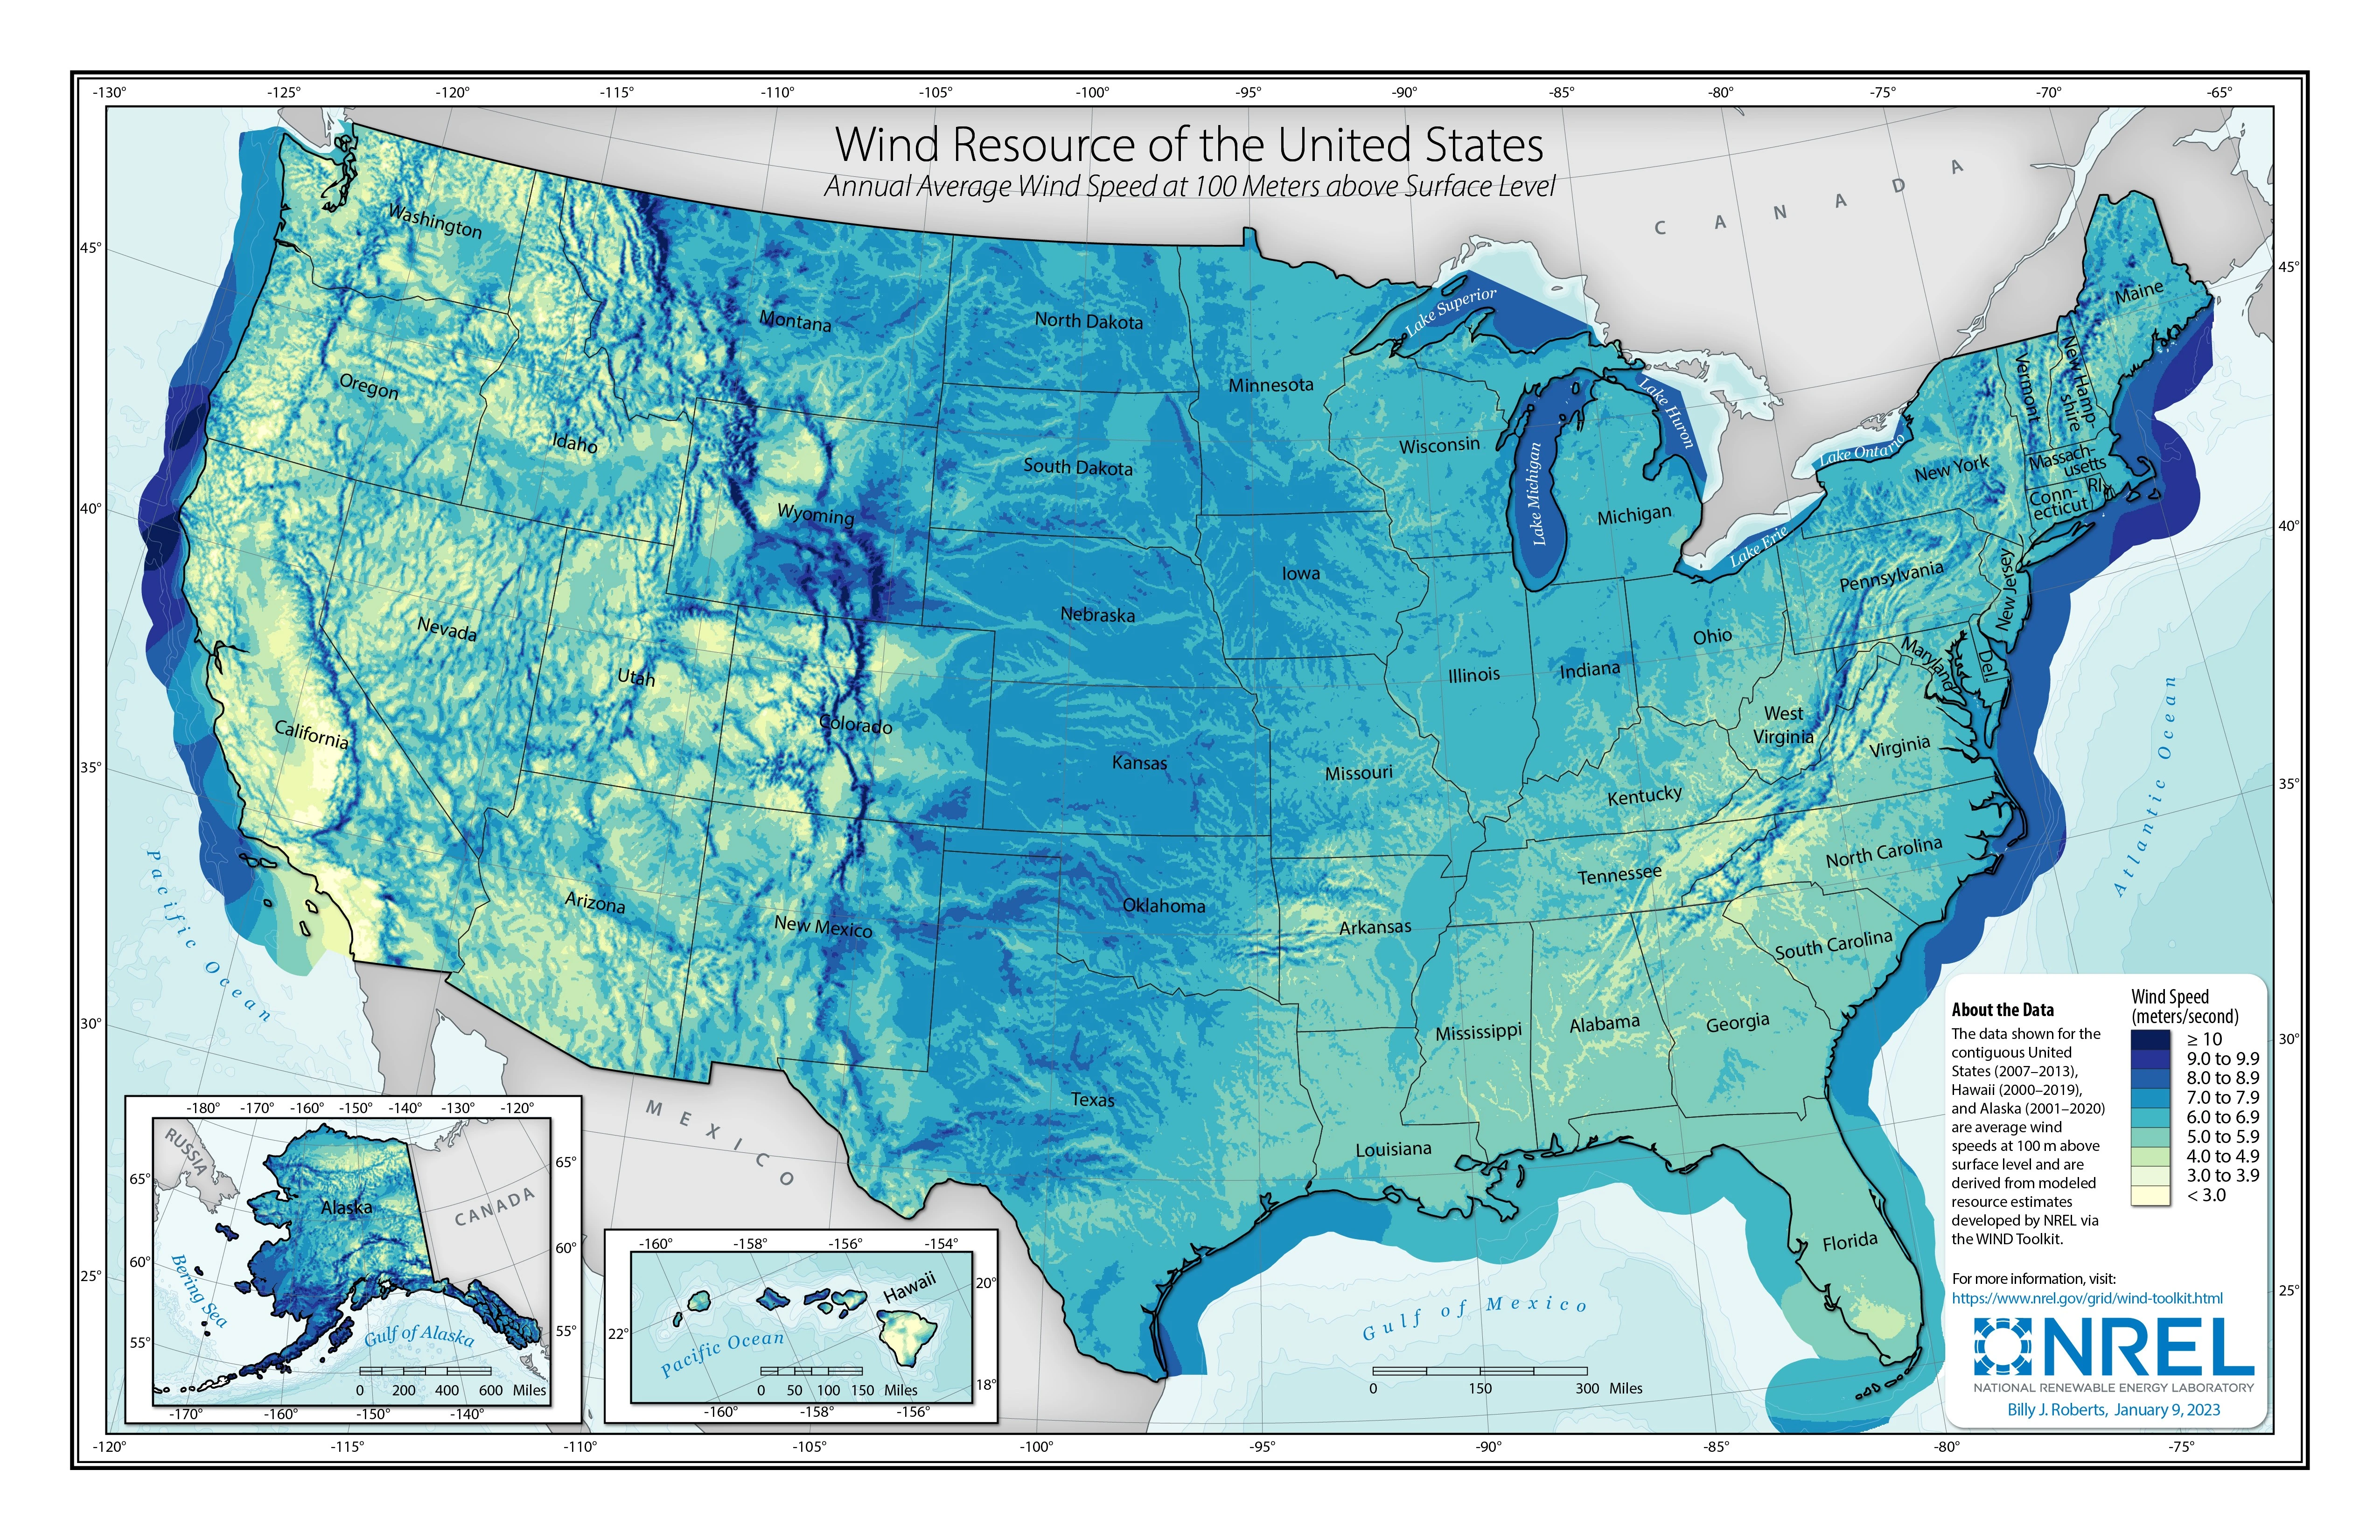
Source: DOE, Offshore Wind Energy
Challenges
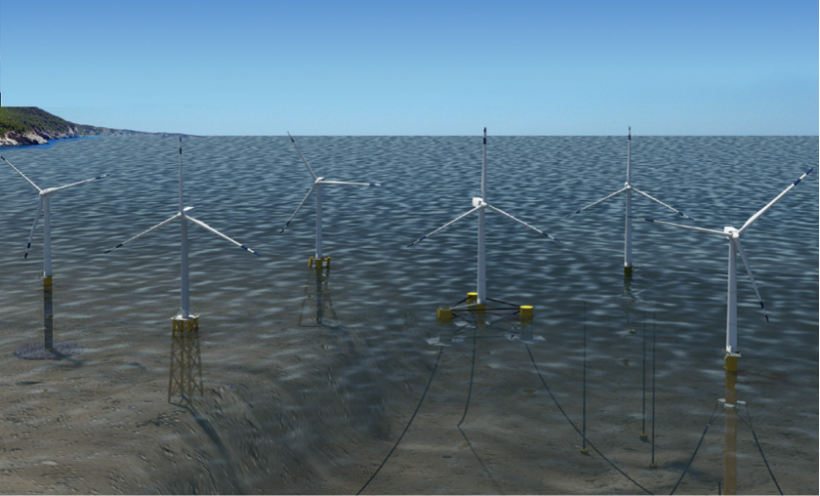
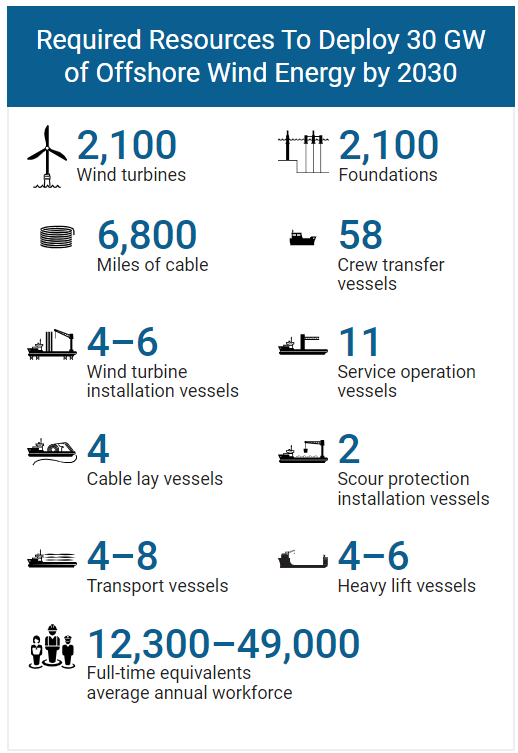
Source: DOE, Top 10 Things You Didn’t Know About Offshore Wind Energy; NREL, Supply Chain Road Map
Low speed wind
Smaller generator. \(\rightarrow\) Decreased generator weight and cost.
Operating at higher capacity in lower wind speeds. \(\rightarrow\) Greater generator efficiency.
Decreased tower head mass. \(\rightarrow\) Decreased foundation and tower costs.
Decreased PE system rating. \(\rightarrow\) Decreased PE system costs
Source: Low Speed Wind Turbines
Pros and Cons
| Pros | Cons |
|---|---|
| Renewables | Variable & integration |
| Low emissions | Land use/NIMBY |
| Low costs | Distribution |
Unexpected benefits
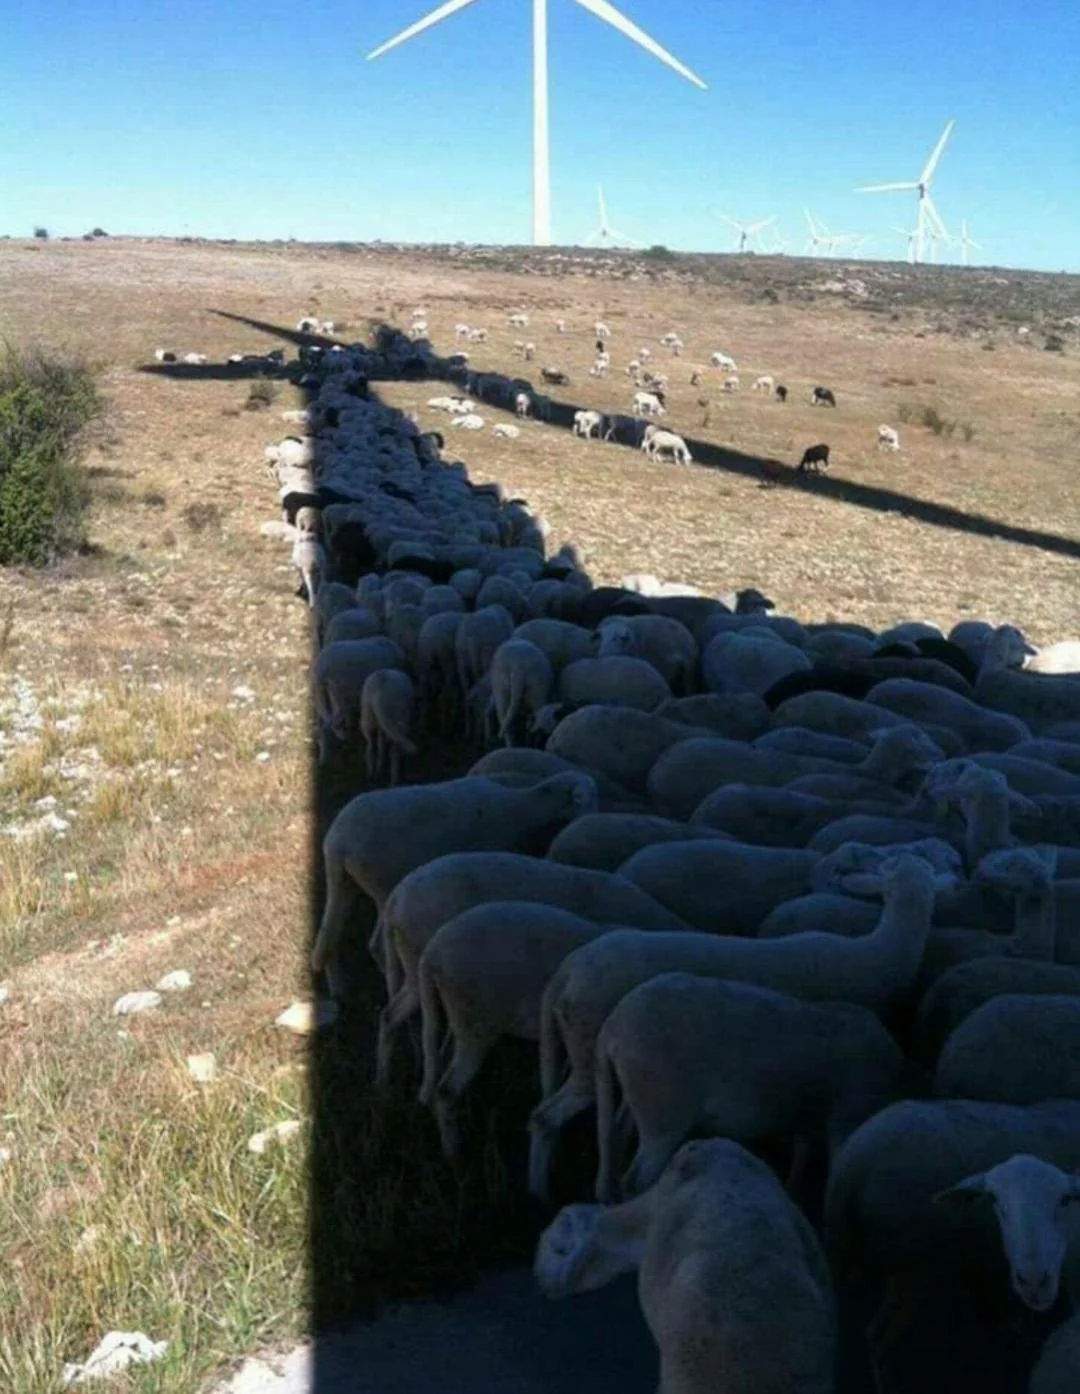
Source: Reddit
Hybrid power systems
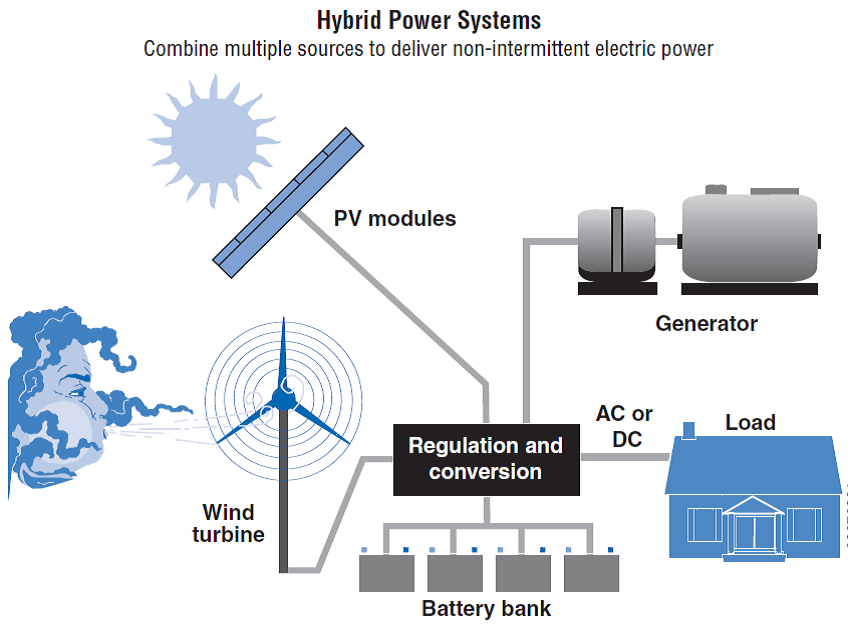
Source: Small Wind Guidebook