Lecture 7 Energy Conversion Technologies
October 21, 2024
Solar

Source: Richard Perez
Solar spectrum
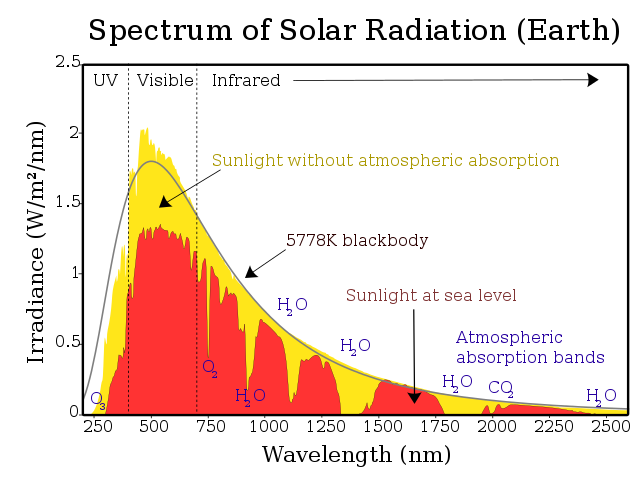
Source: Solar Spectrum
Harvesting the sun

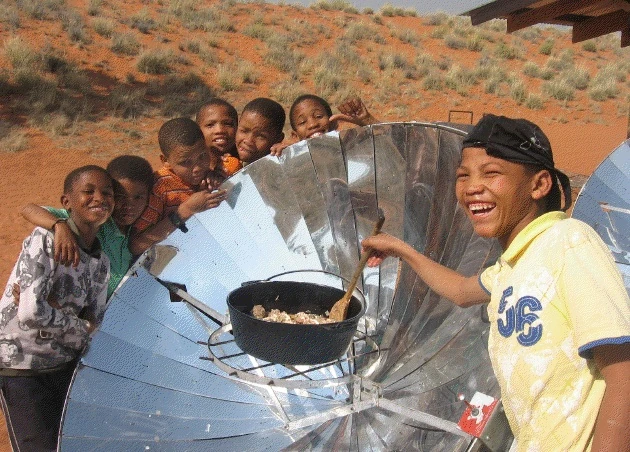
Photo credit: Bristol Energy, Fu Ting; Source: Solar Cooking
Silicon
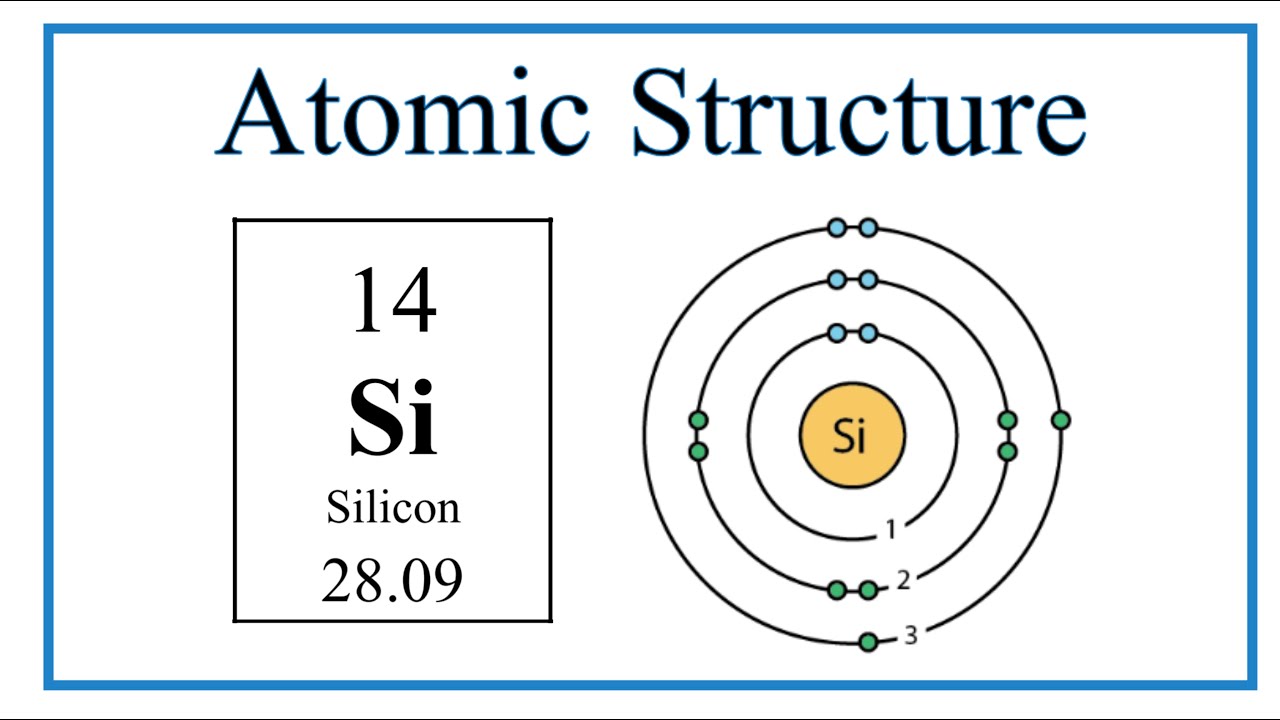
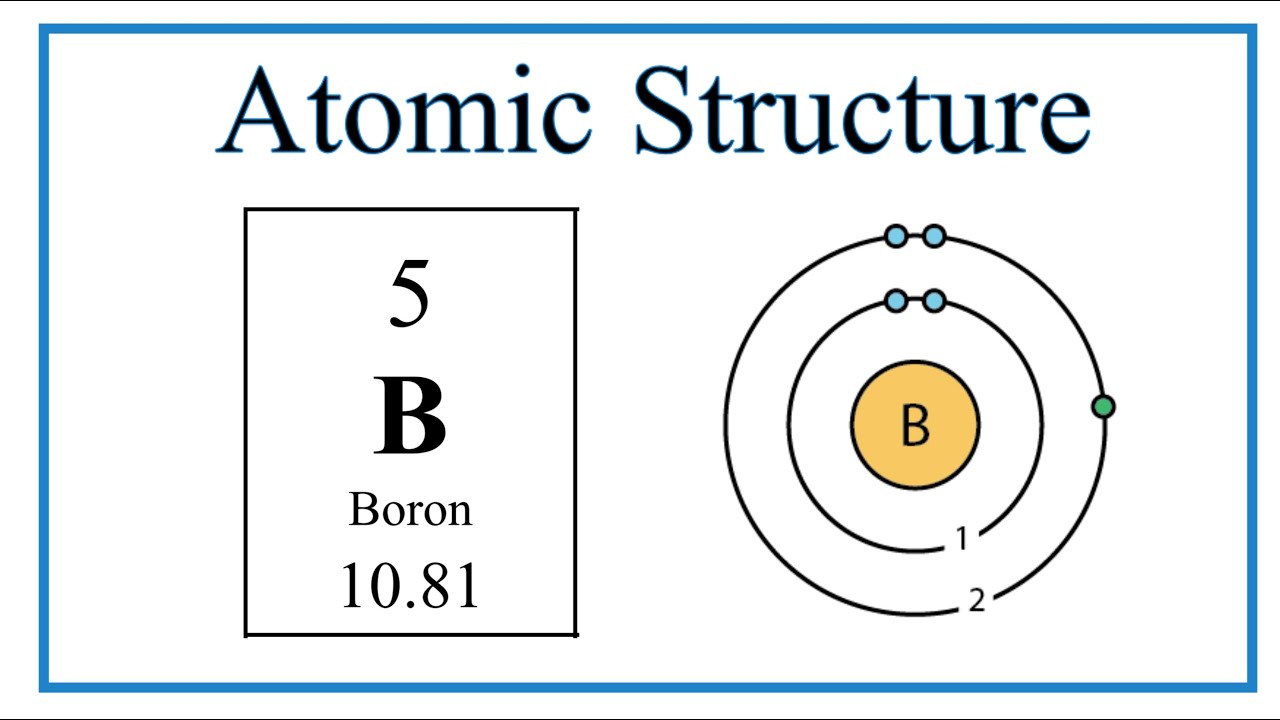
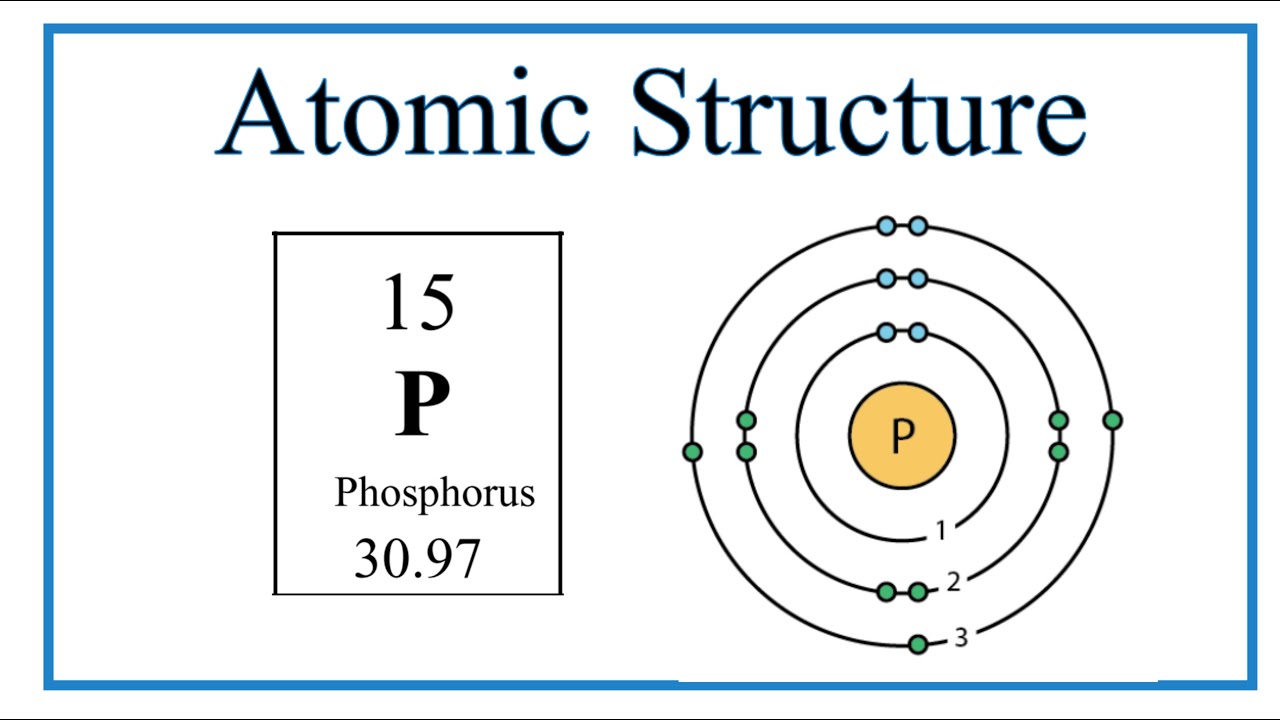
Source: Atomic Structures
P and N type
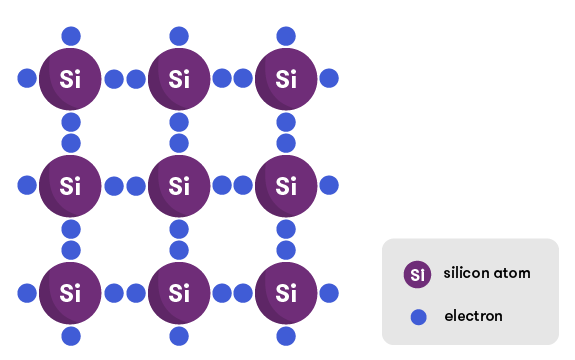
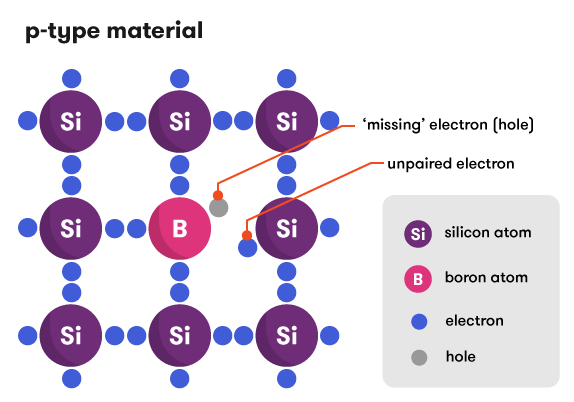
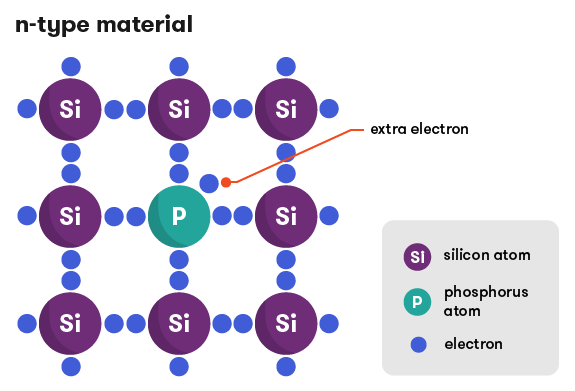
Source: From sunlight to electricity
P-N Junction
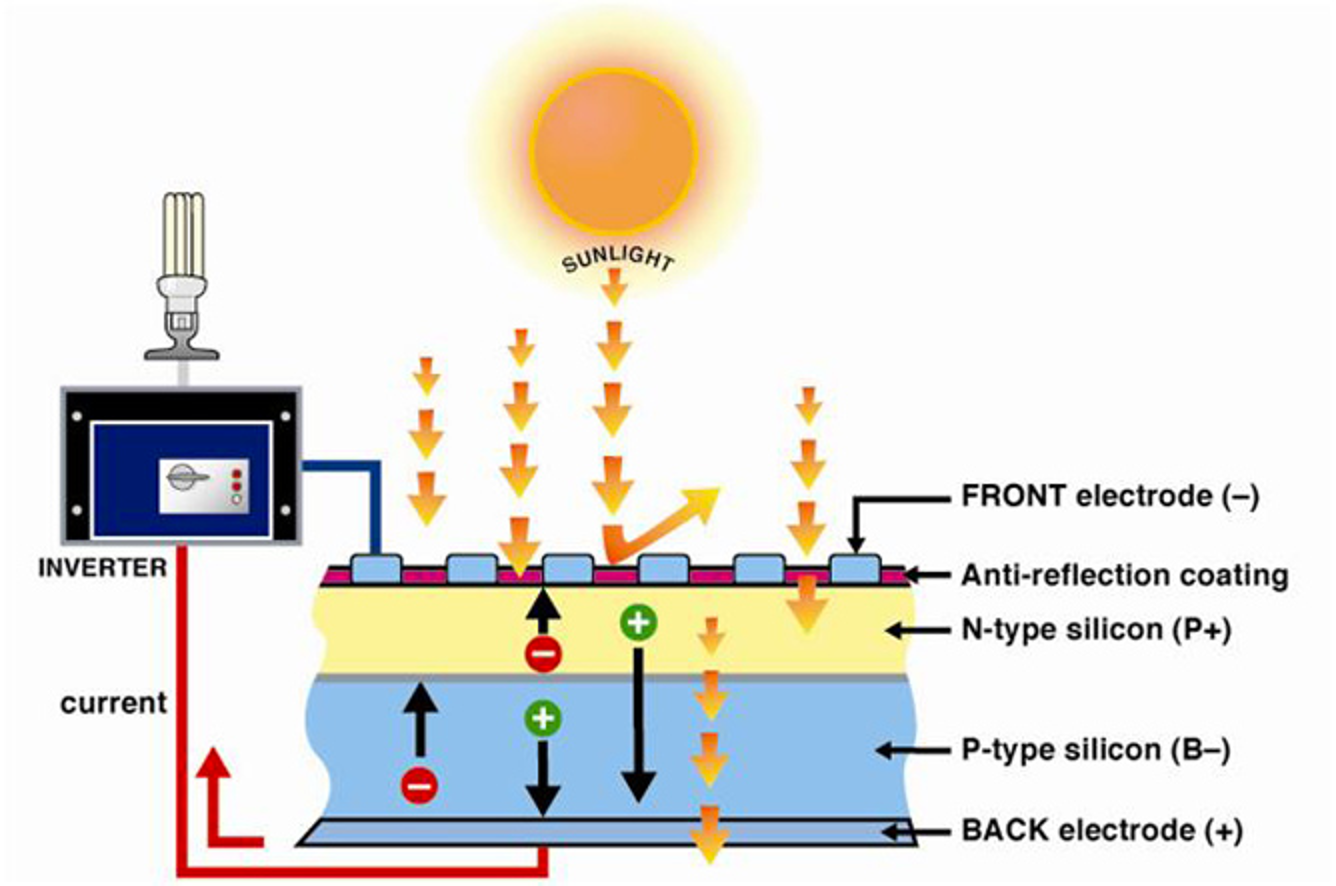
How solar works
Solar irradiance
- Direct normal irradiance (DNI)
- Diffuse horizontal irradiance (DHI)
- Ground reflected irradiance (GRI)
- Global horizontal irradiance (GHI)
- Plane-of-array irradiance (POA)
GHI=DNI+DHI+GRI
POA = GHI \(\times \cos \theta\)
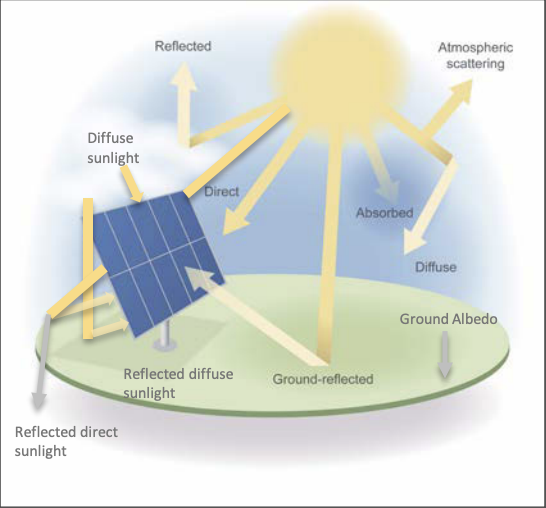
Source: Manajit Sengupta, Aron Habte, NREL
Key corrections
- Solar position at any time of day: altitude angle, latitude, zaimuth angle, hour angle
- Radiation: direct beam, diffusion, reflected
- Tracking: fixed, 1-axis, 2-axis
Read more: Masters (2013)
The quest for efficiency
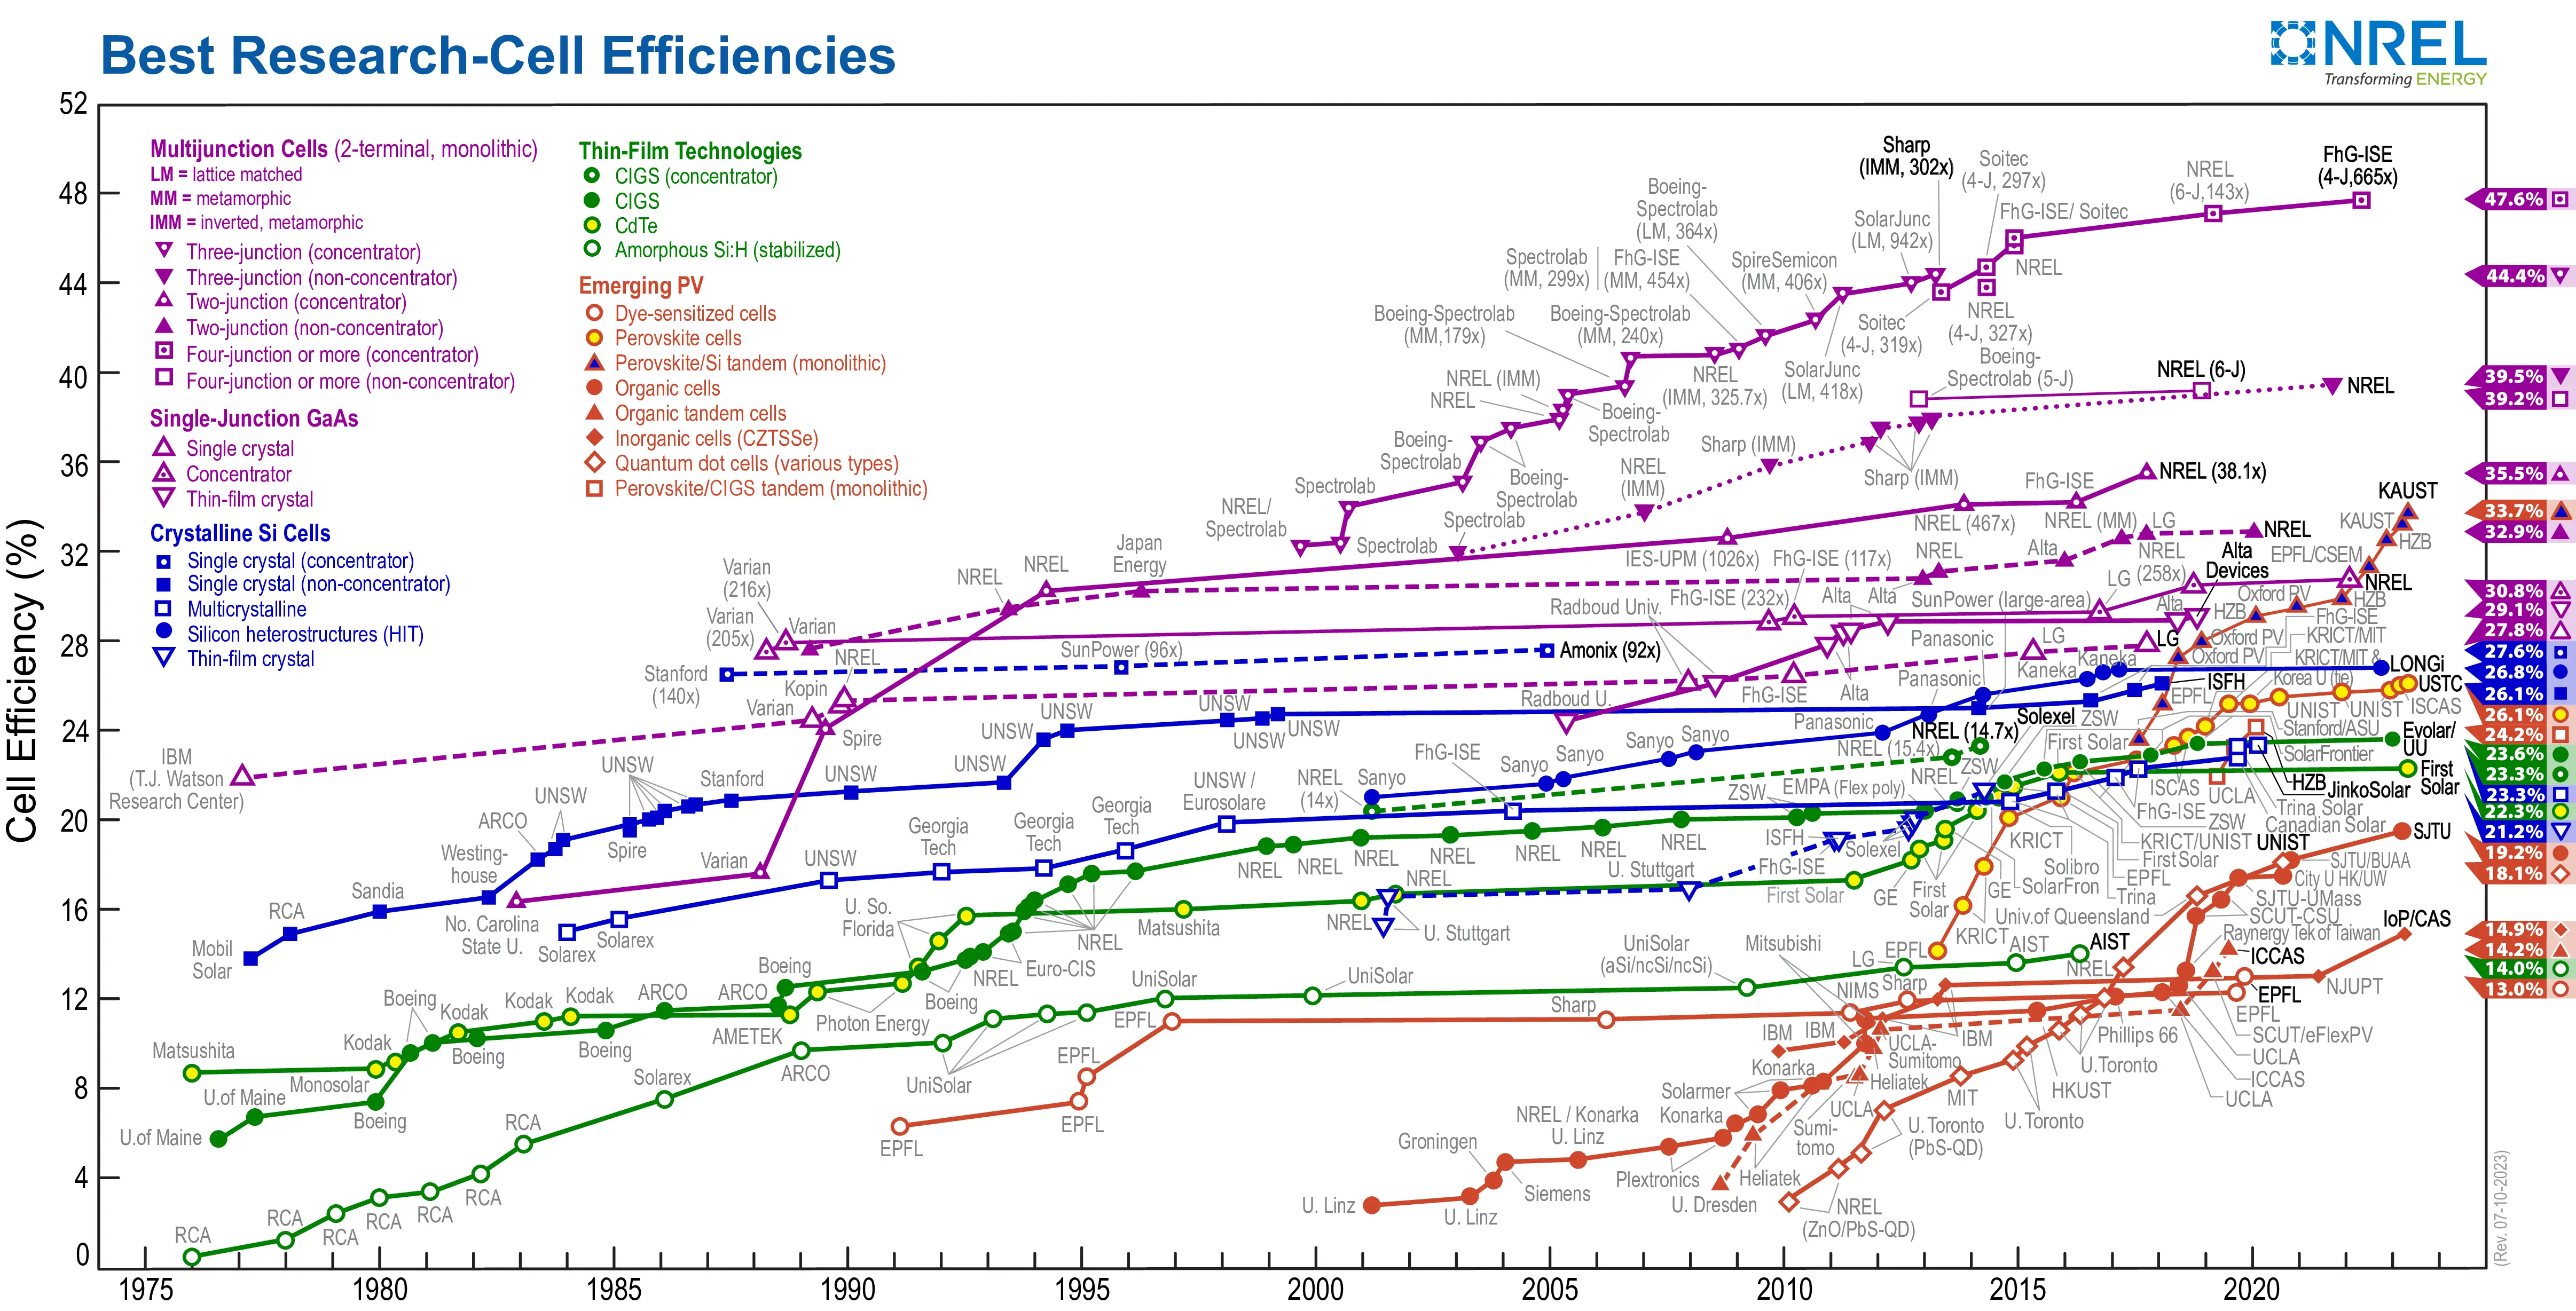
Read more: NREL, Best Research-Cell Efficiency Chart
Global and U.S. distribution
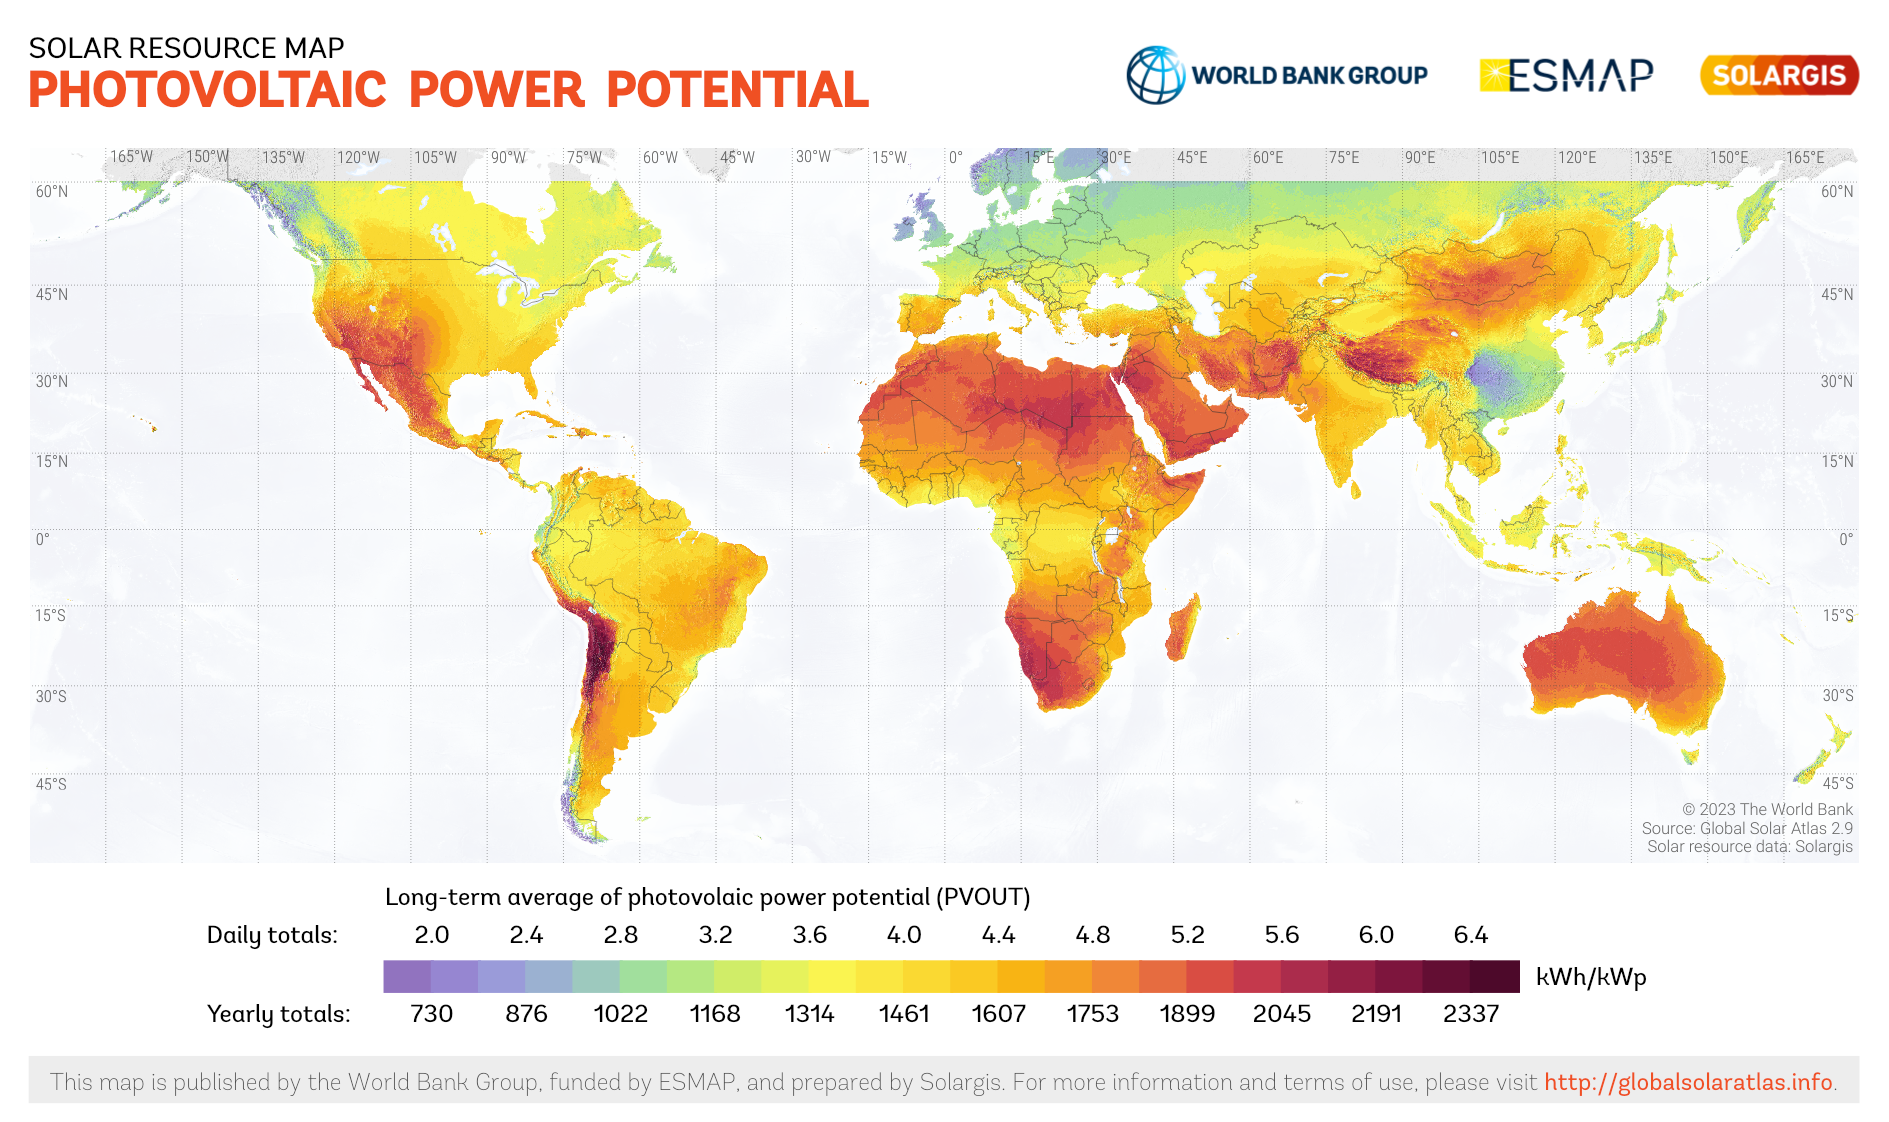
Source: Global Solar Atlas
Air pollution and dust
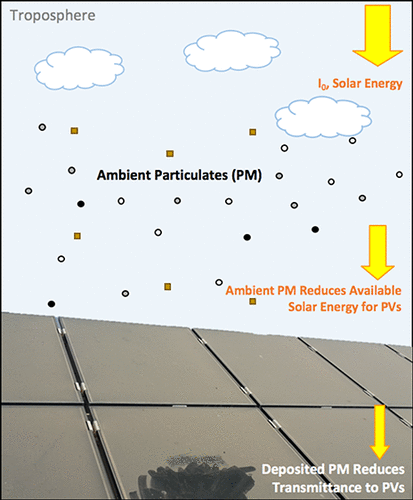
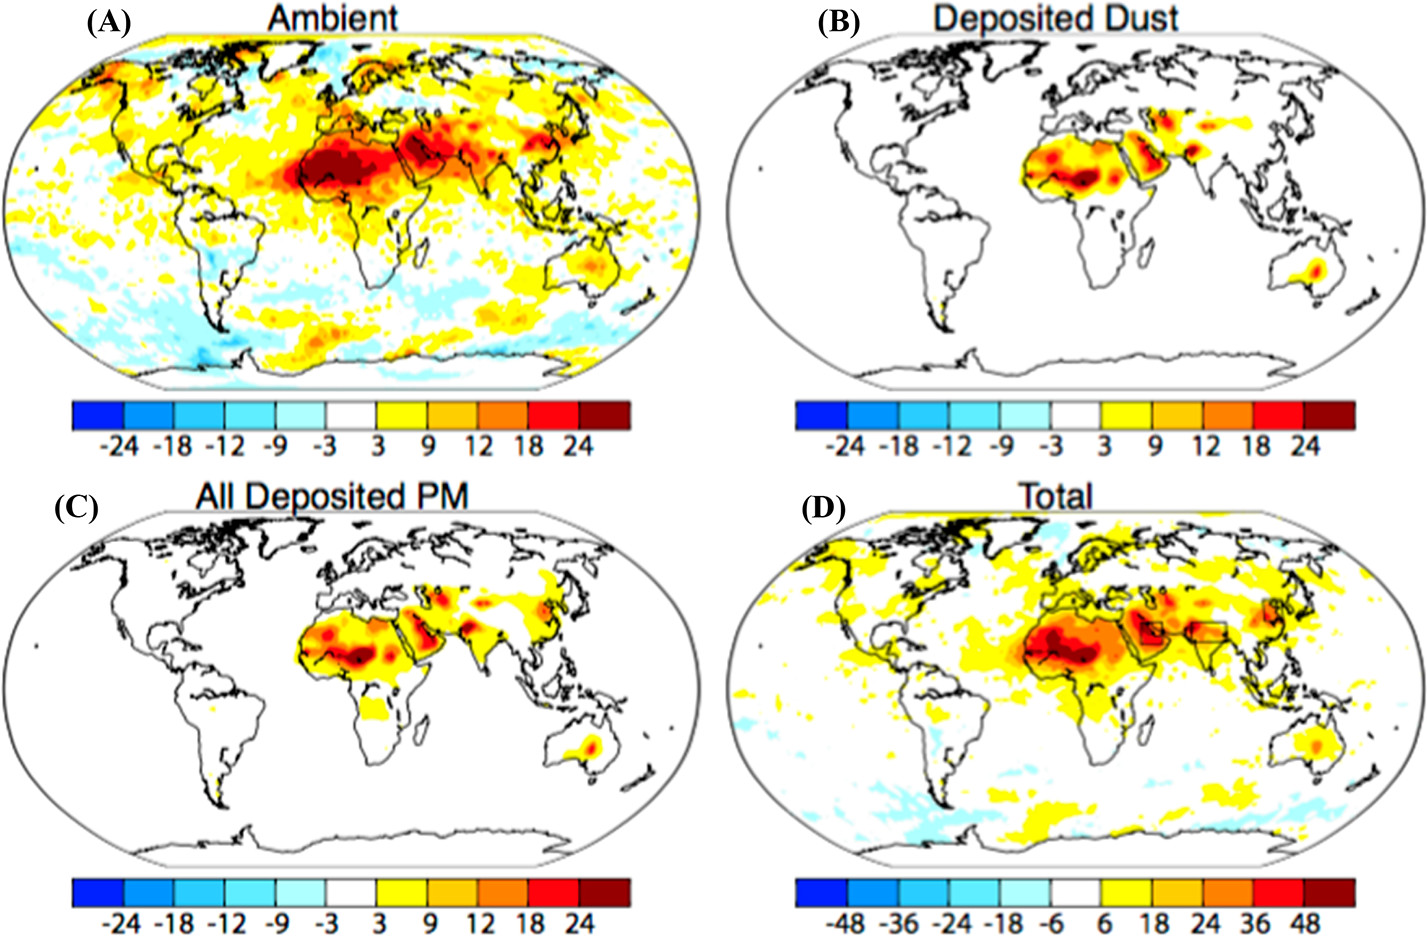
Source: Bergin et al. (2017)
Prioritize solar installation
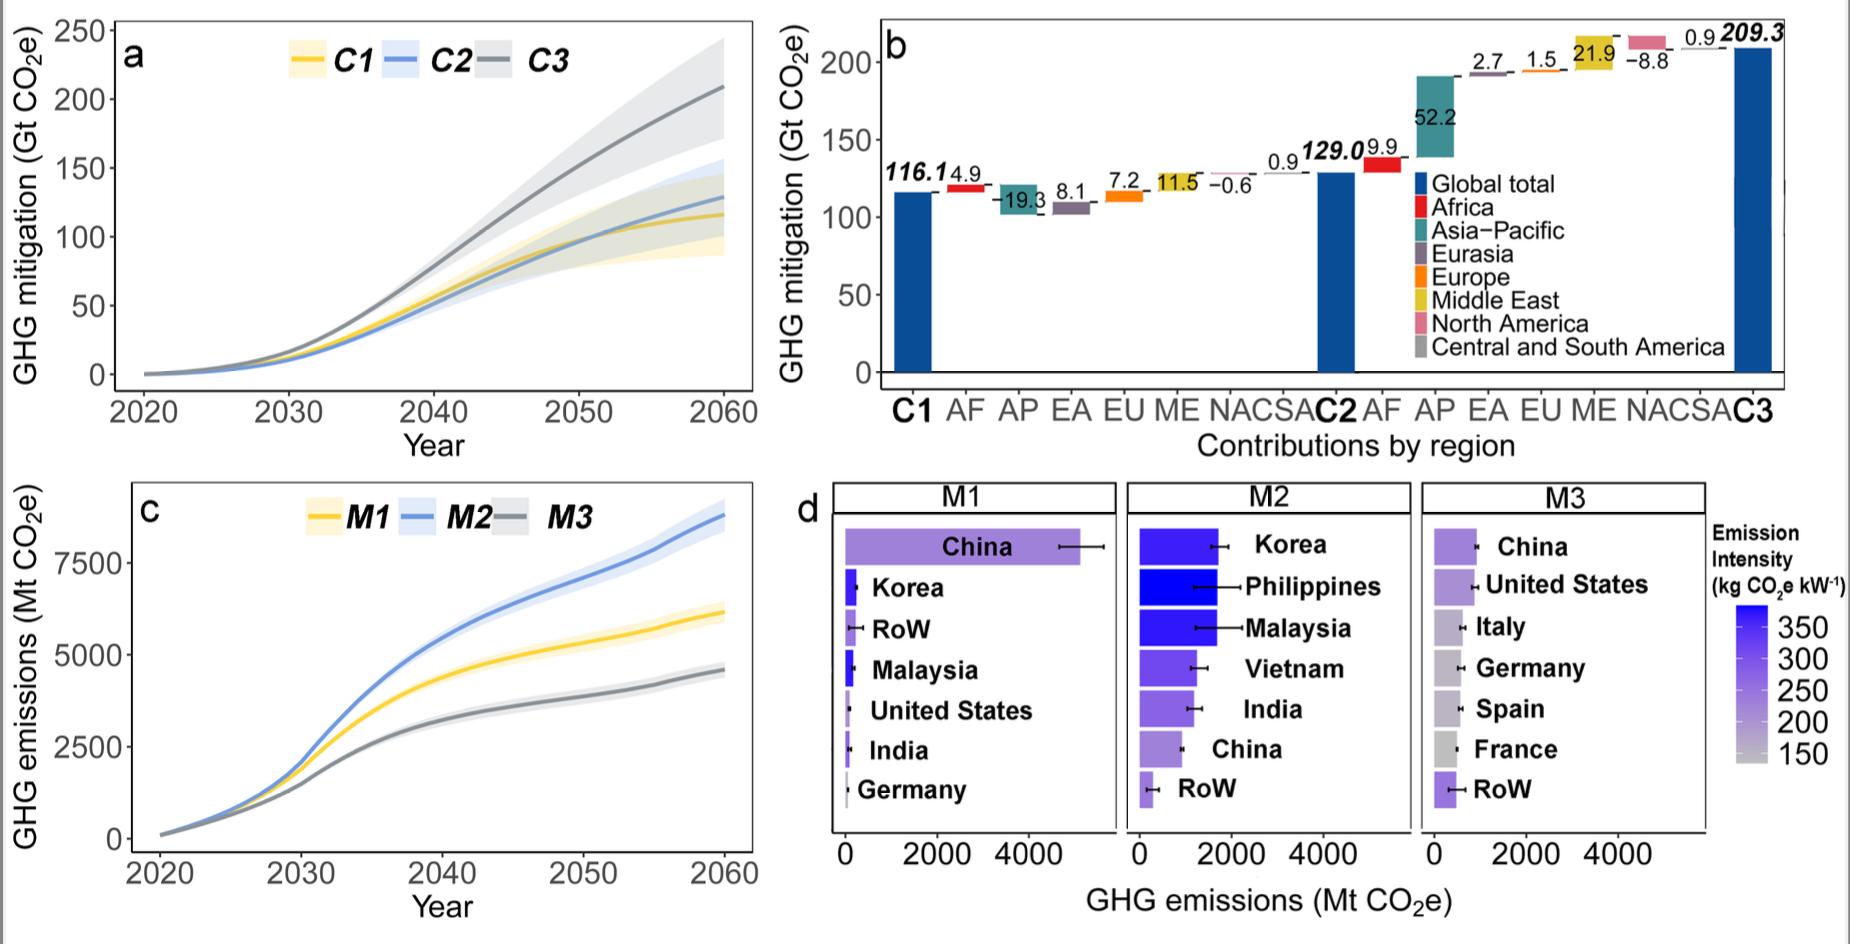
Source: Chen et al. (2023)
Solar thermal: CSP
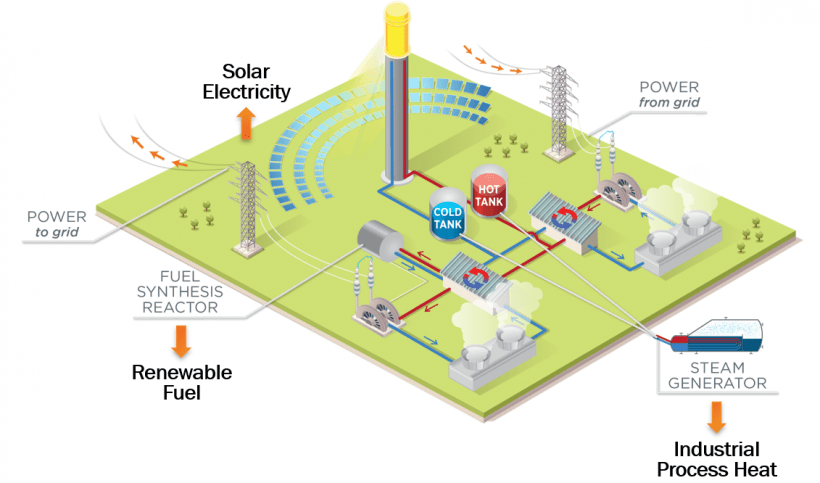
Source: DOE
Wind
\(P=\frac{1}{2}\rho \pi r^2 v^3\)
Where,
\(\rho\) = Air Density (\(kg/m^3\))
\(A\) = Swept Area (\(m^2\)) = \(\pi r^2\)
\(v\) = Wind Speed (m/s)
\(P\) = Power (W)
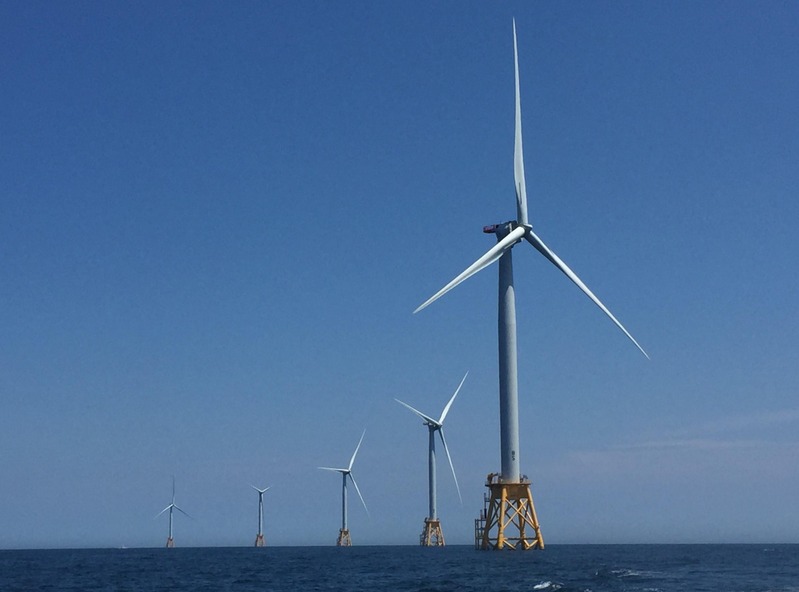
Photo by Gang He, Block Island Offshore Wind Farm
Betz’s law: 59.3%
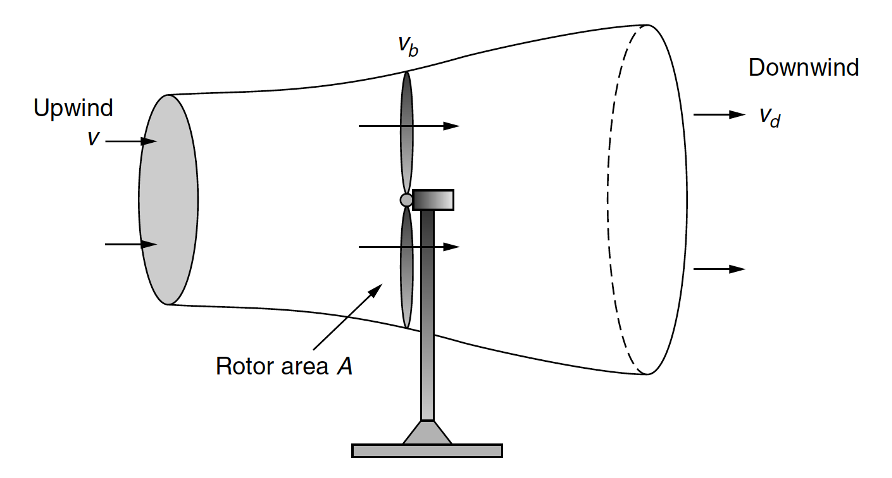
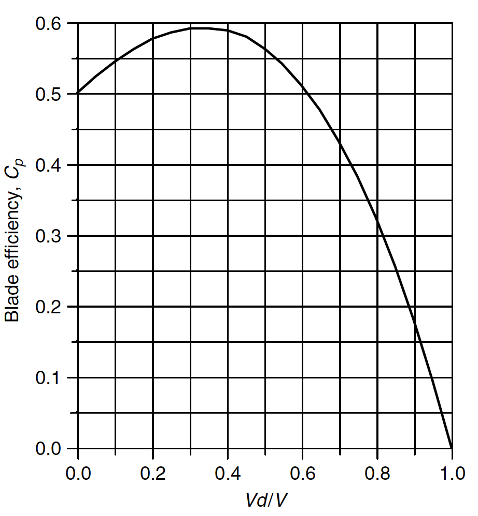
Source: Masters (2013)
Average power
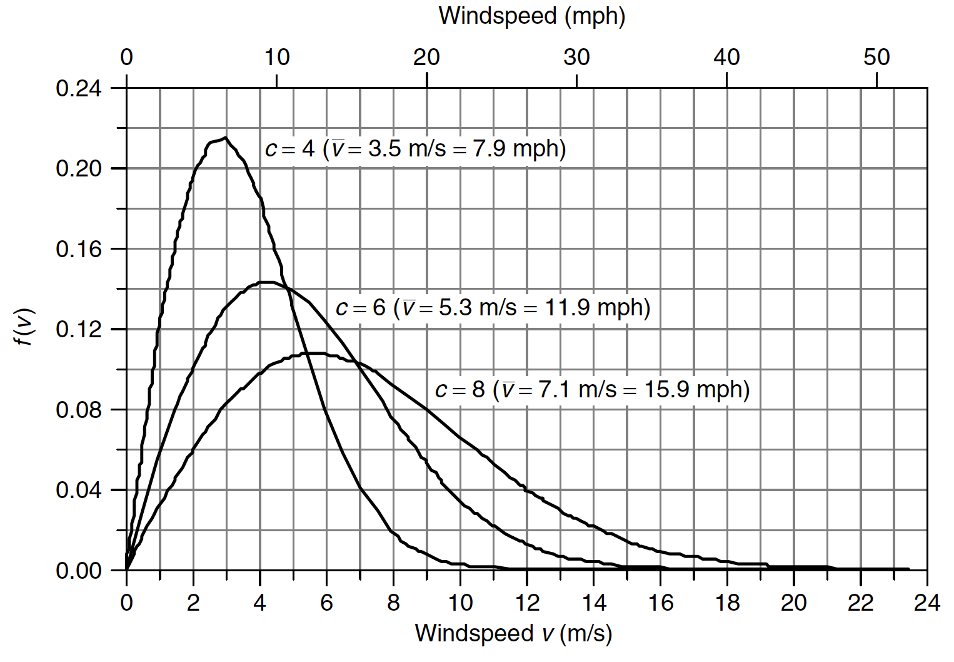
Rayleigh (a special type of Weibull) distribution
\(f(v)=\frac{2v}{c^2}\exp [-(\frac{v}{c})^2]\)
\(\bar{P}=\frac{6}{\pi}\cdot \frac{1}{2}\rho \pi r^2 (\bar{v})^3=1.91P\)
Use average power when dealing with average wind speed
Read more: Masters (2013)
Power curve
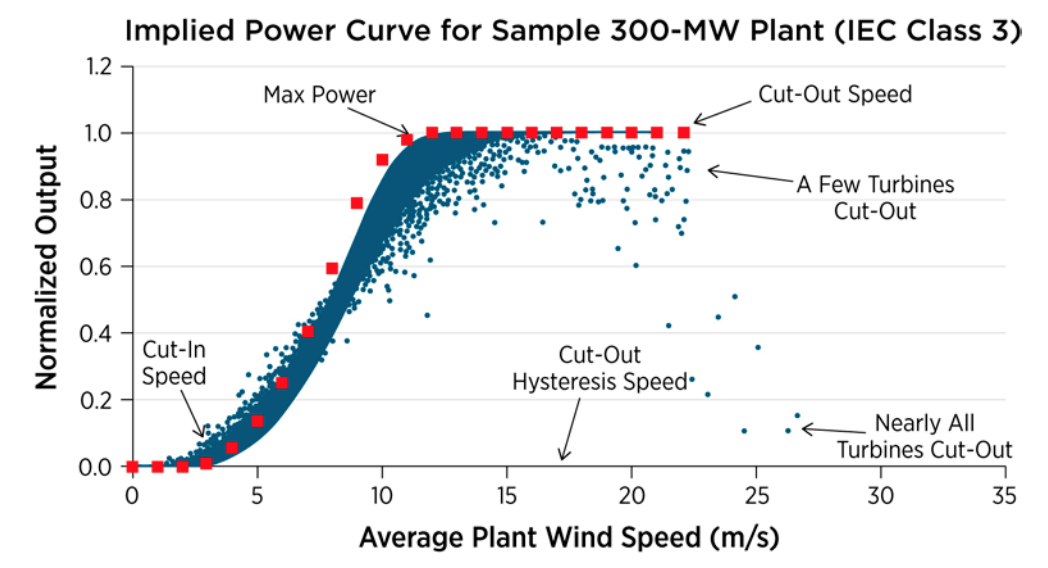
Read more: NREL, Validation of Power Output for the WIND Toolkit
Important corrections
- Temperature: \(\rho = \frac{P\times M.W. \times 10^{-3}}{RT}=\frac{1 atm\times 28.97 g/mol \times 10^{-3}kg/g}{8.2056\times 10^{-5}m^3\cdot atm/(K\cdot mol)\times(273.15+T)K}\)
- Altitude: \(P=P_0 e^{-1.185\times 10^{-4}H}\) (H is elevation in meters)
- Tower height: \(\frac{v}{v_0}=(\frac{H}{H_0})^\alpha\) (\(\alpha\) is the friction coefficient)
Read more: Masters (2013)
Class of wind resources
| Class | 10 m (33 ft) | 50 m (164 ft) | ||
|---|---|---|---|---|
| Wind power density (W/m2) | Speed m/s (mph) | Wind power density (W/m2) | Speed m/s (mph) | |
| 1 | 0 - 100 | 0 - 4.4 (0 - 9.8) | 0 - 200 | 0 - 5.6 (0 - 12.5) |
| 2 | 100 - 150 | 4.4 - 5.1 (9.8 - 11.5) | 200 - 300 | 5.6 - 6.4 (12.5 - 14.3) |
| 3 | 150 - 200 | 5.1 - 5.6 (11.5 - 12.5) | 300 - 400 | 6.4 - 7.0 (14.3 - 15.7) |
| 4 | 200 - 250 | 5.6 - 6.0 (12.5 - 13.4) | 400 - 500 | 7.0 - 7.5 (15.7 - 16.8) |
| 5 | 250 - 300 | 6.0 - 6.4 (13.4 - 14.3) | 500 - 600 | 7.5 - 8.0 (16.8 - 17.9) |
| 6 | 300 - 400 | 6.4 - 7.0 (14.3 - 15.7) | 600 - 800 | 8.0 - 8.8 (17.9 - 19.7) |
| 7 | 400 - 1000 | 7.0 - 9.4 (15.7 - 21.1) | 800 - 2000 | 8.8 - 11.9 (19.7 - 26.6) |
Source: NREL
Global wind power density map
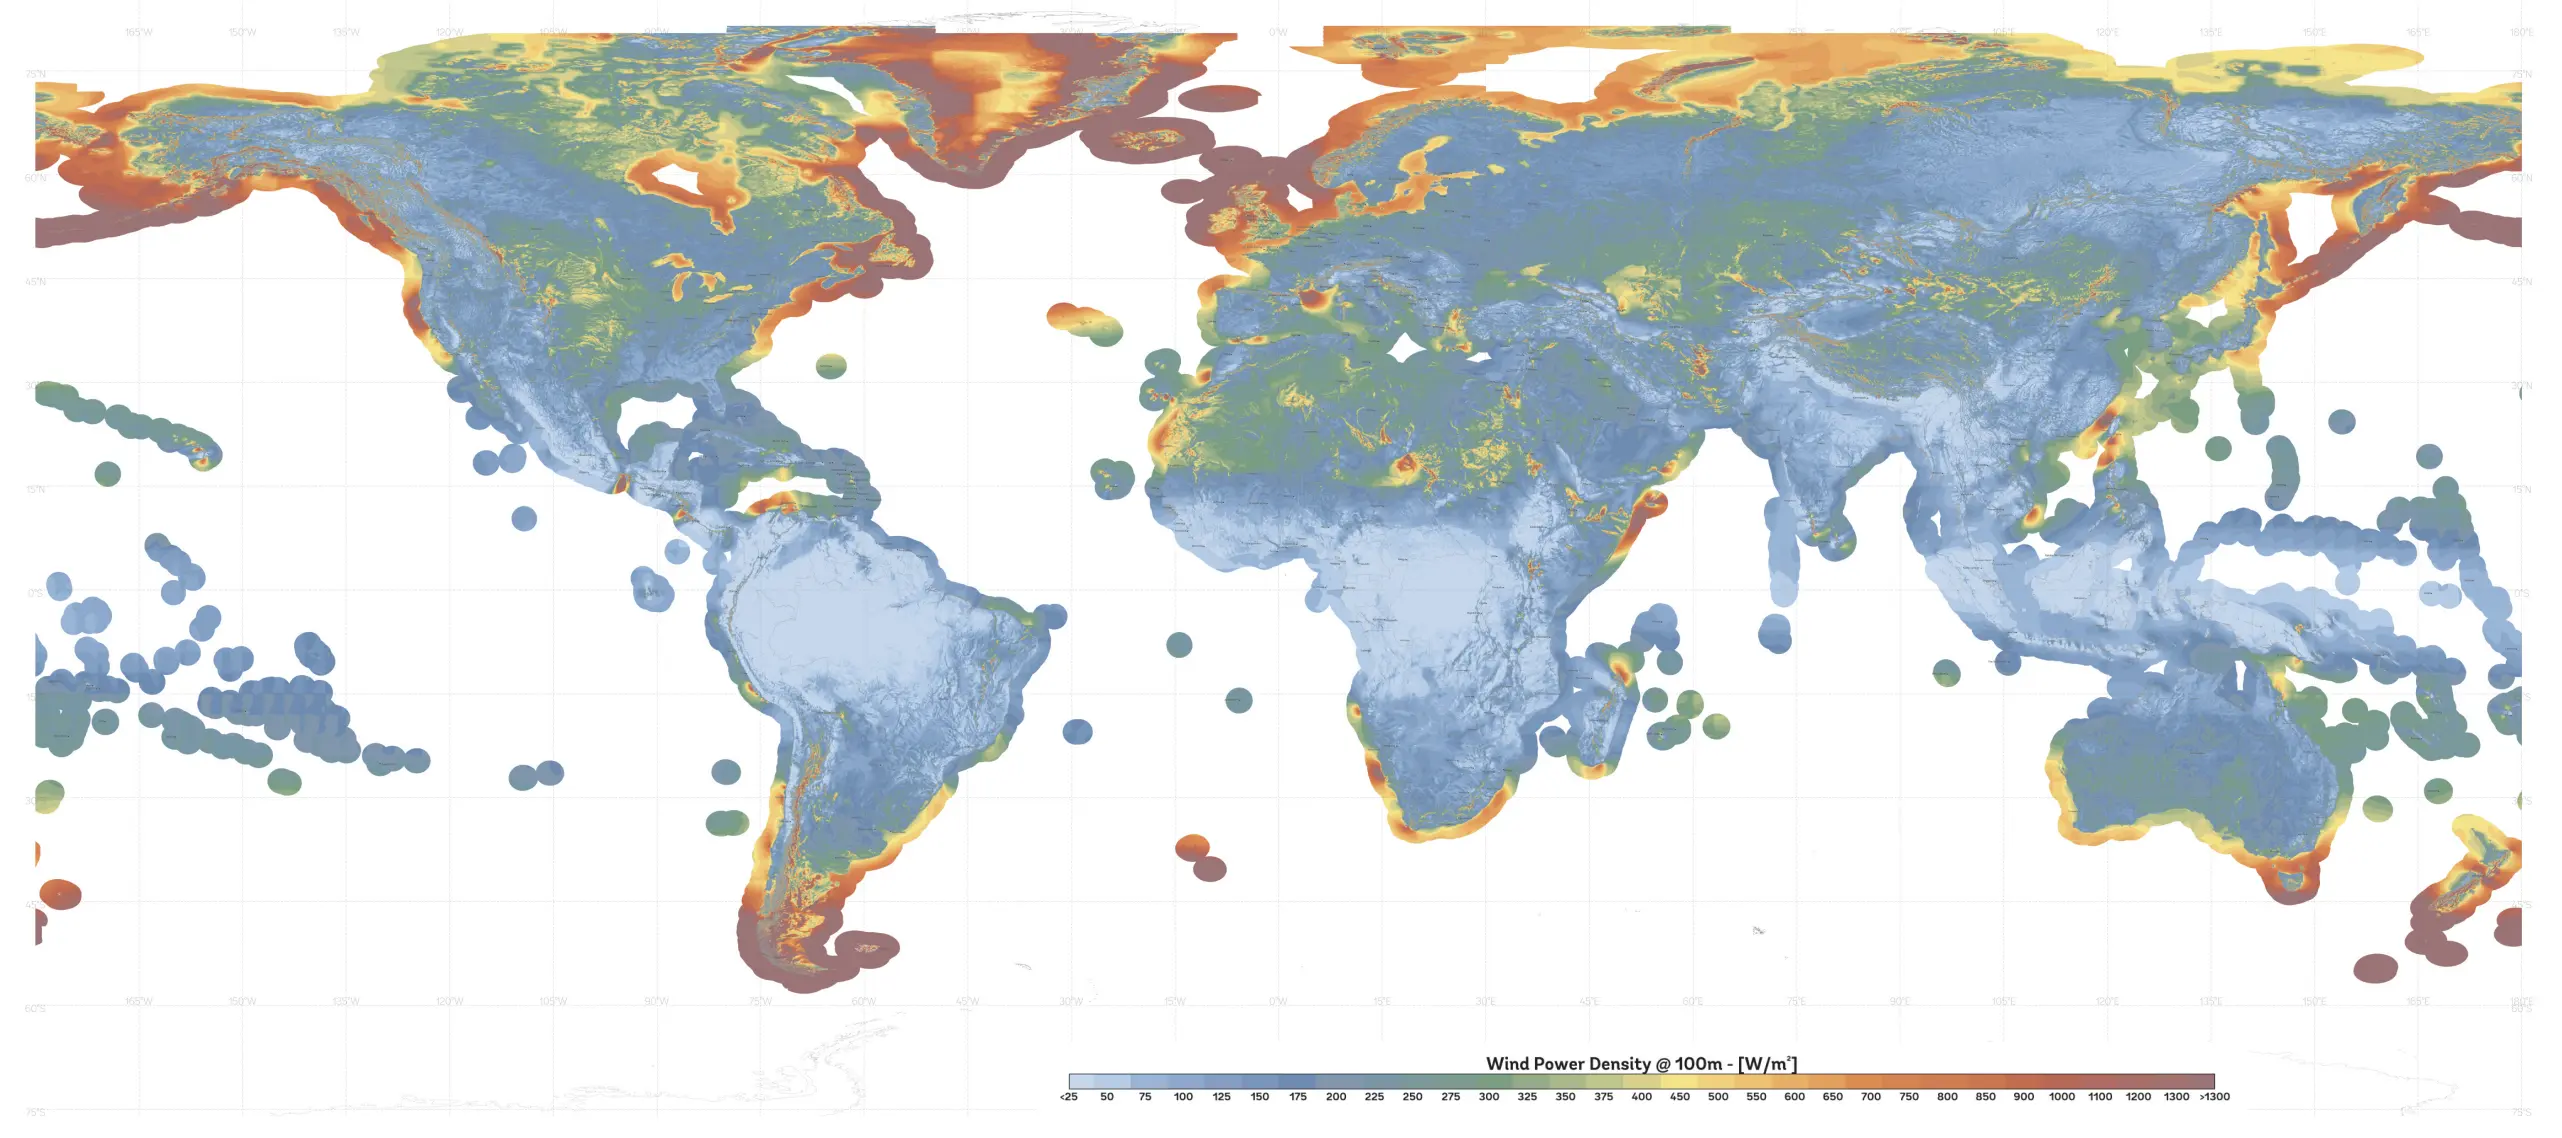
Source: Global Wind Atlas
Higher and bigger
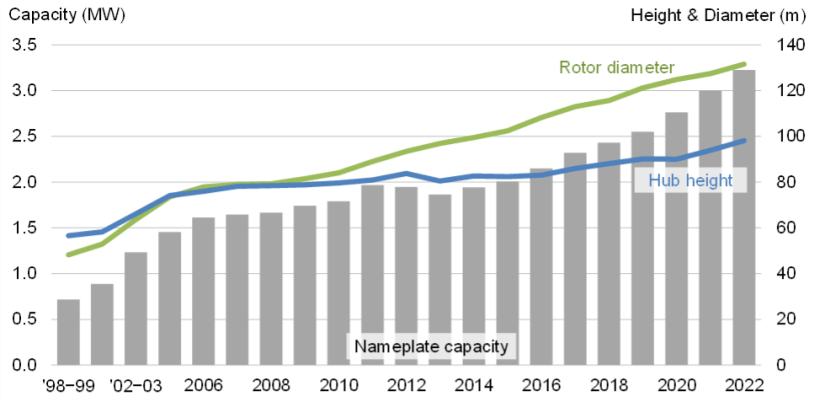
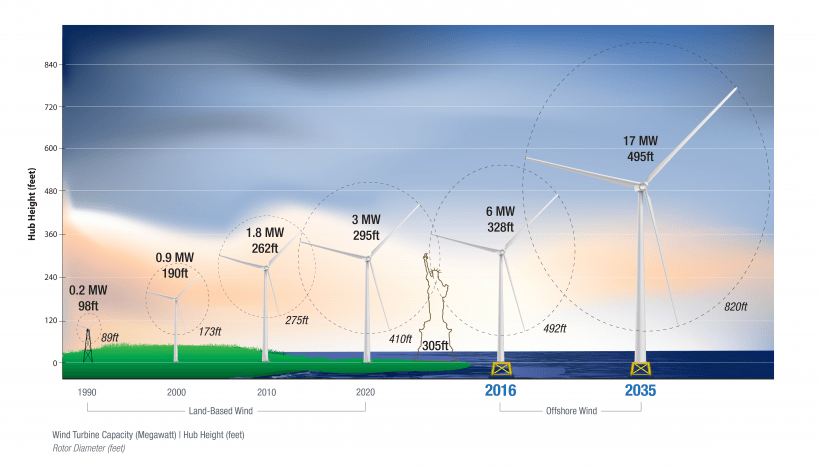
Offshore wind
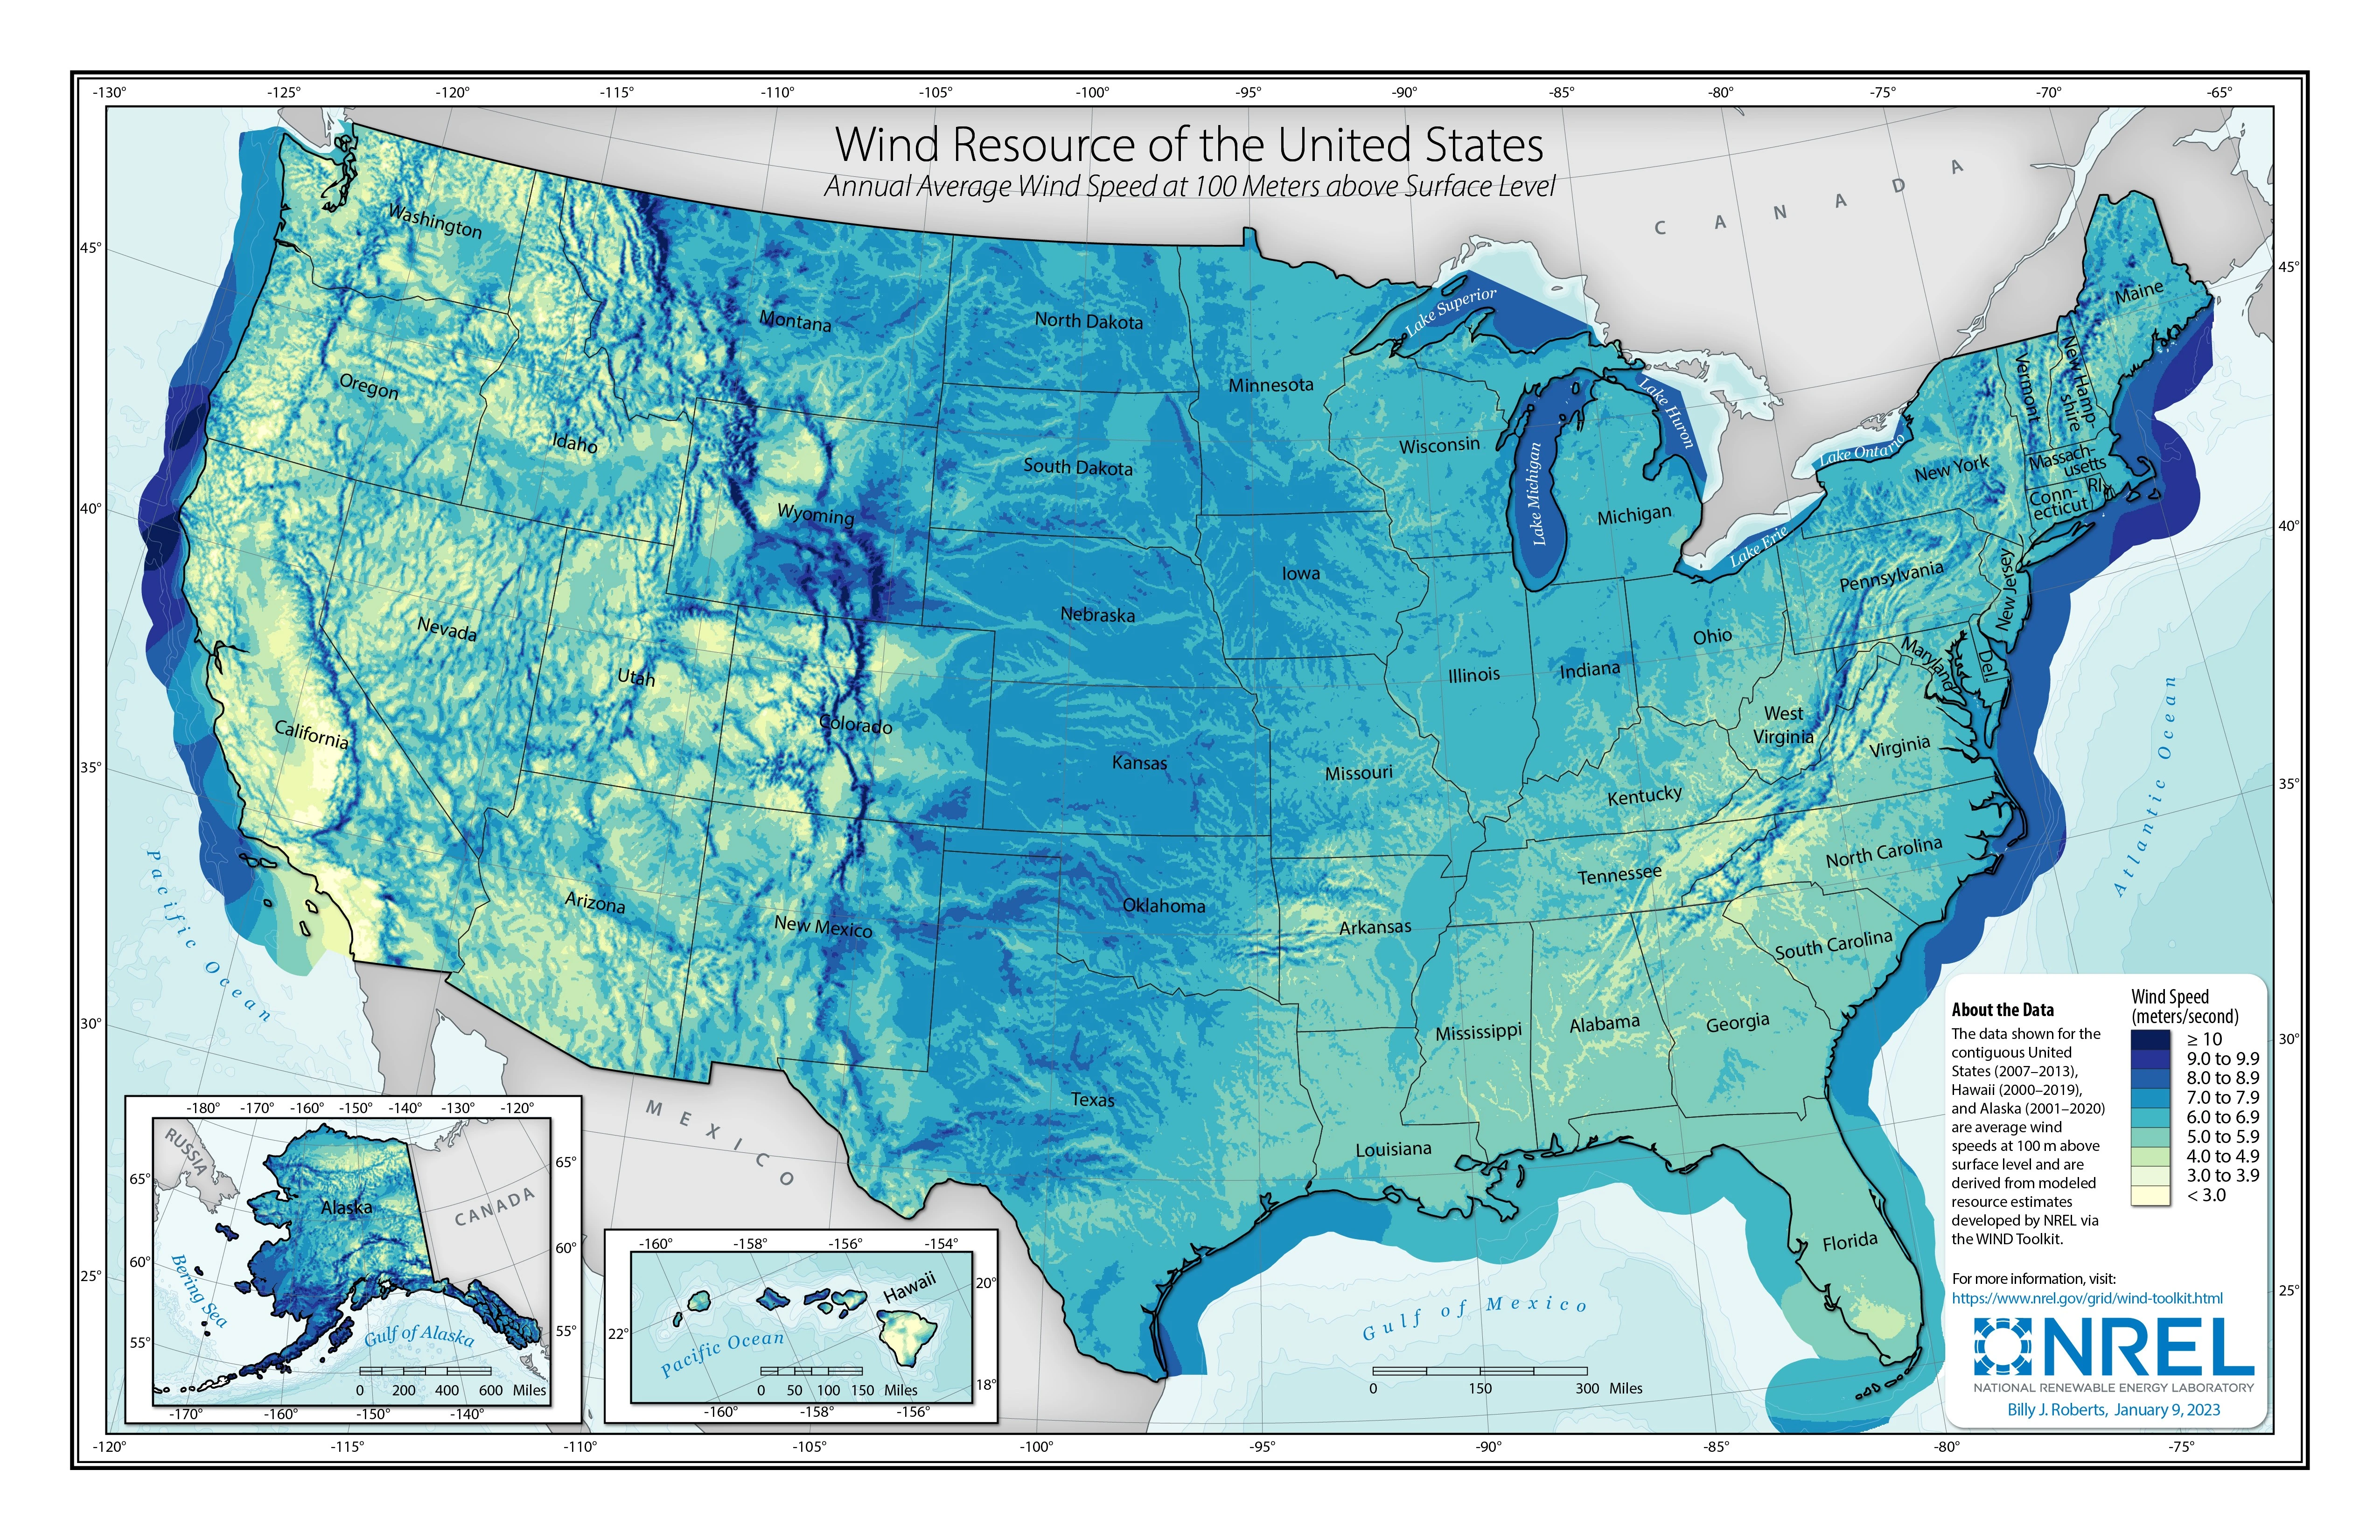
Source: DOE, Offshore Wind Energy
Challenges
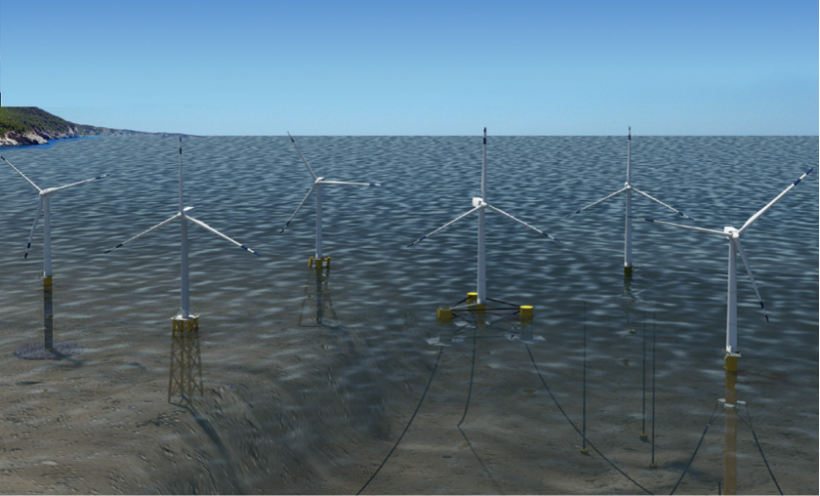
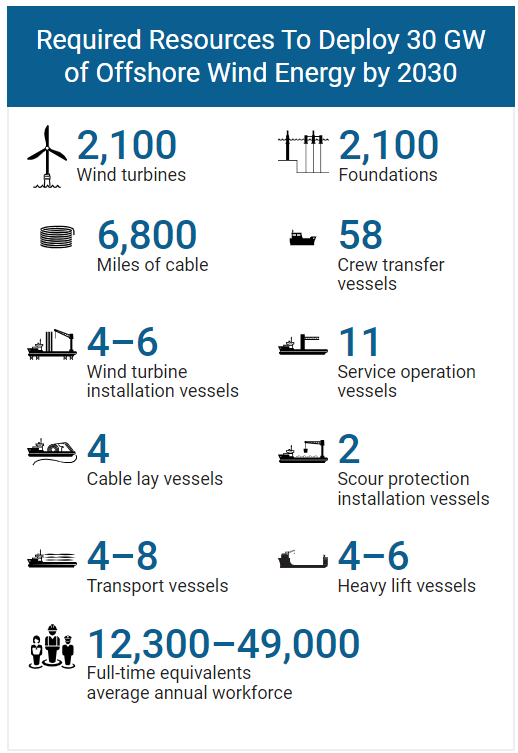
Source: DOE, Top 10 Things You Didn’t Know About Offshore Wind Energy; NREL, Supply Chain Road Map
Low speed wind
Smaller generator. \(\rightarrow\) Decreased generator weight and cost.
Operating at higher capacity in lower wind speeds. \(\rightarrow\) Greater generator efficiency.
Decreased tower head mass. \(\rightarrow\) Decreased foundation and tower costs.
Decreased PE system rating. \(\rightarrow\) Decreased PE system costs
Source: Low Speed Wind Turbines
Unexpected benefits
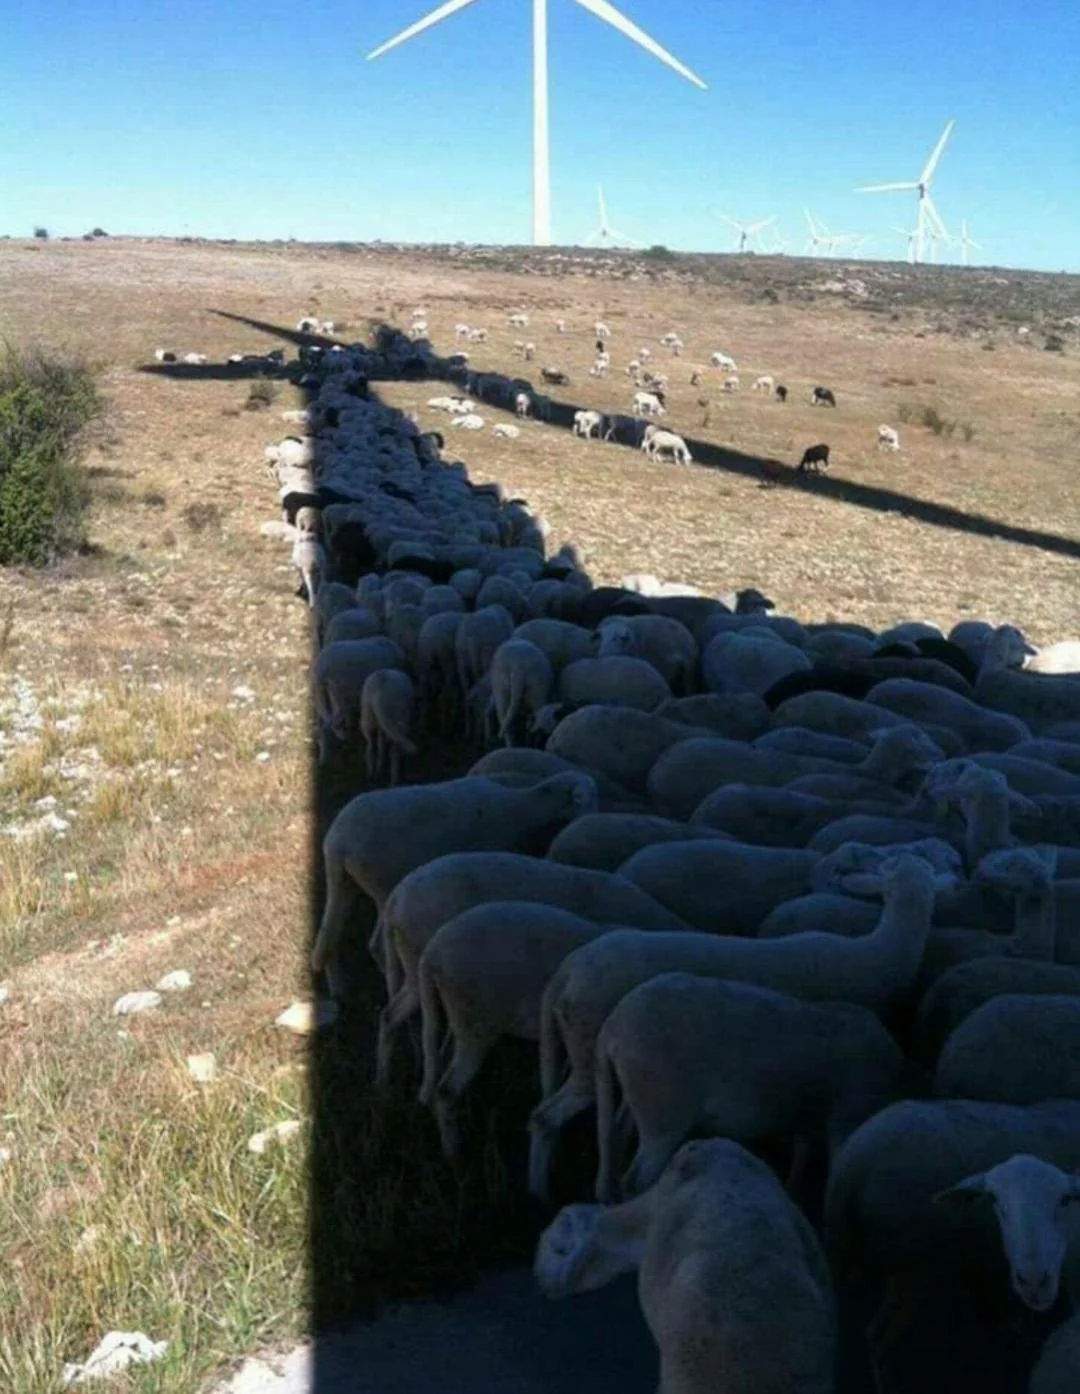
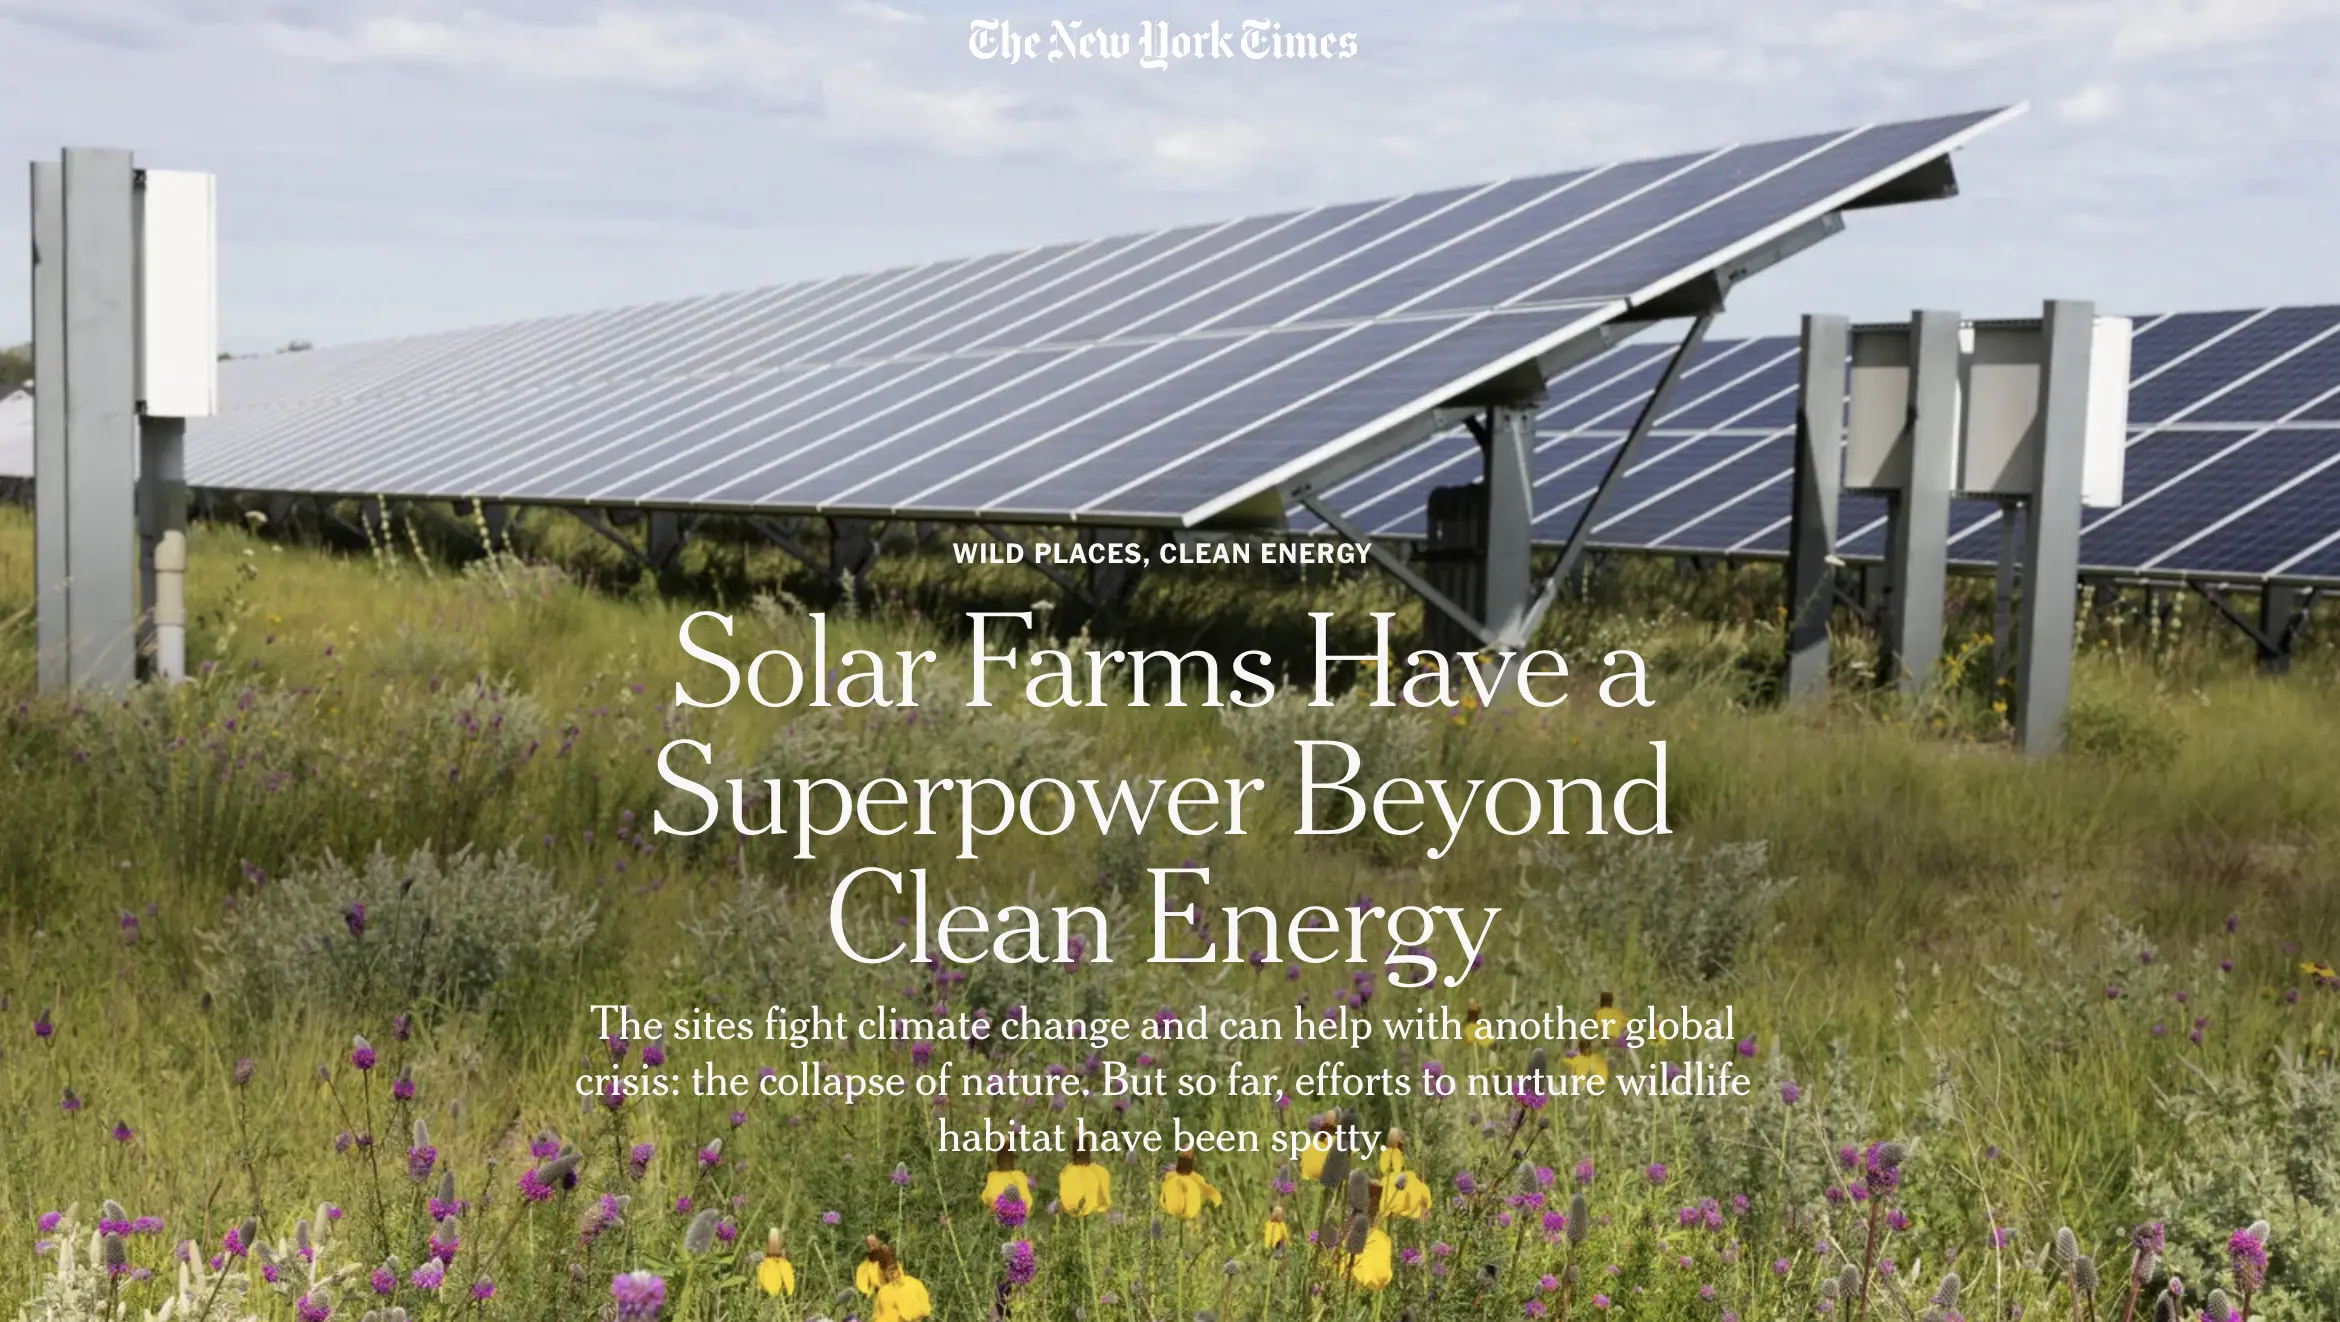
Source: Reddit; New York Times
Climate change impact

Source: Liu et al. (2023)
Pros and Cons
| Pros | Cons |
|---|---|
| Renewables | Variable & integration |
| Low emissions | Land use & NIMBY |
| Low costs | Distribution |
Hybrid power systems
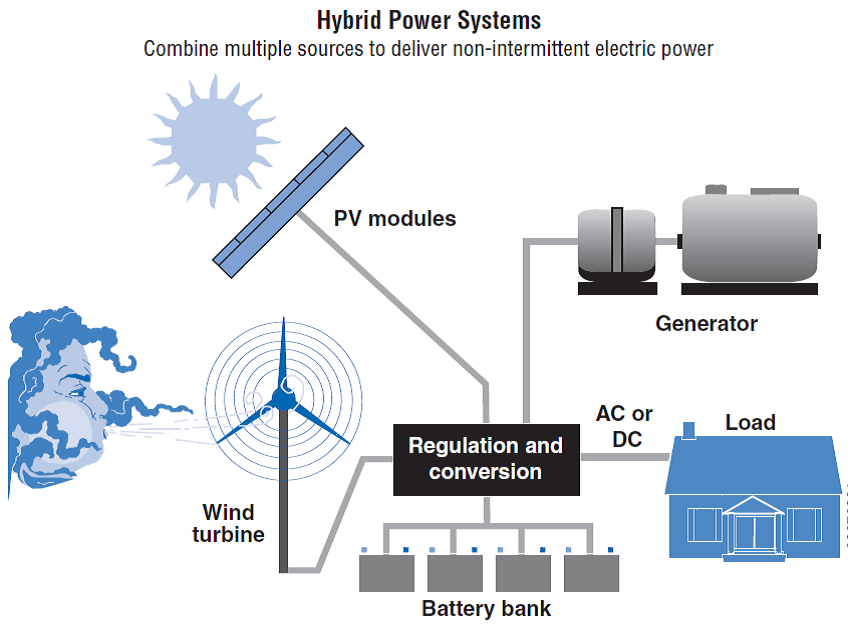
Source: Small Wind Guidebook
Thermodynamics
- Thermodynamic efficiency
- Comparing different technologies
- Thermodynamics provides physic limits
Heat engine
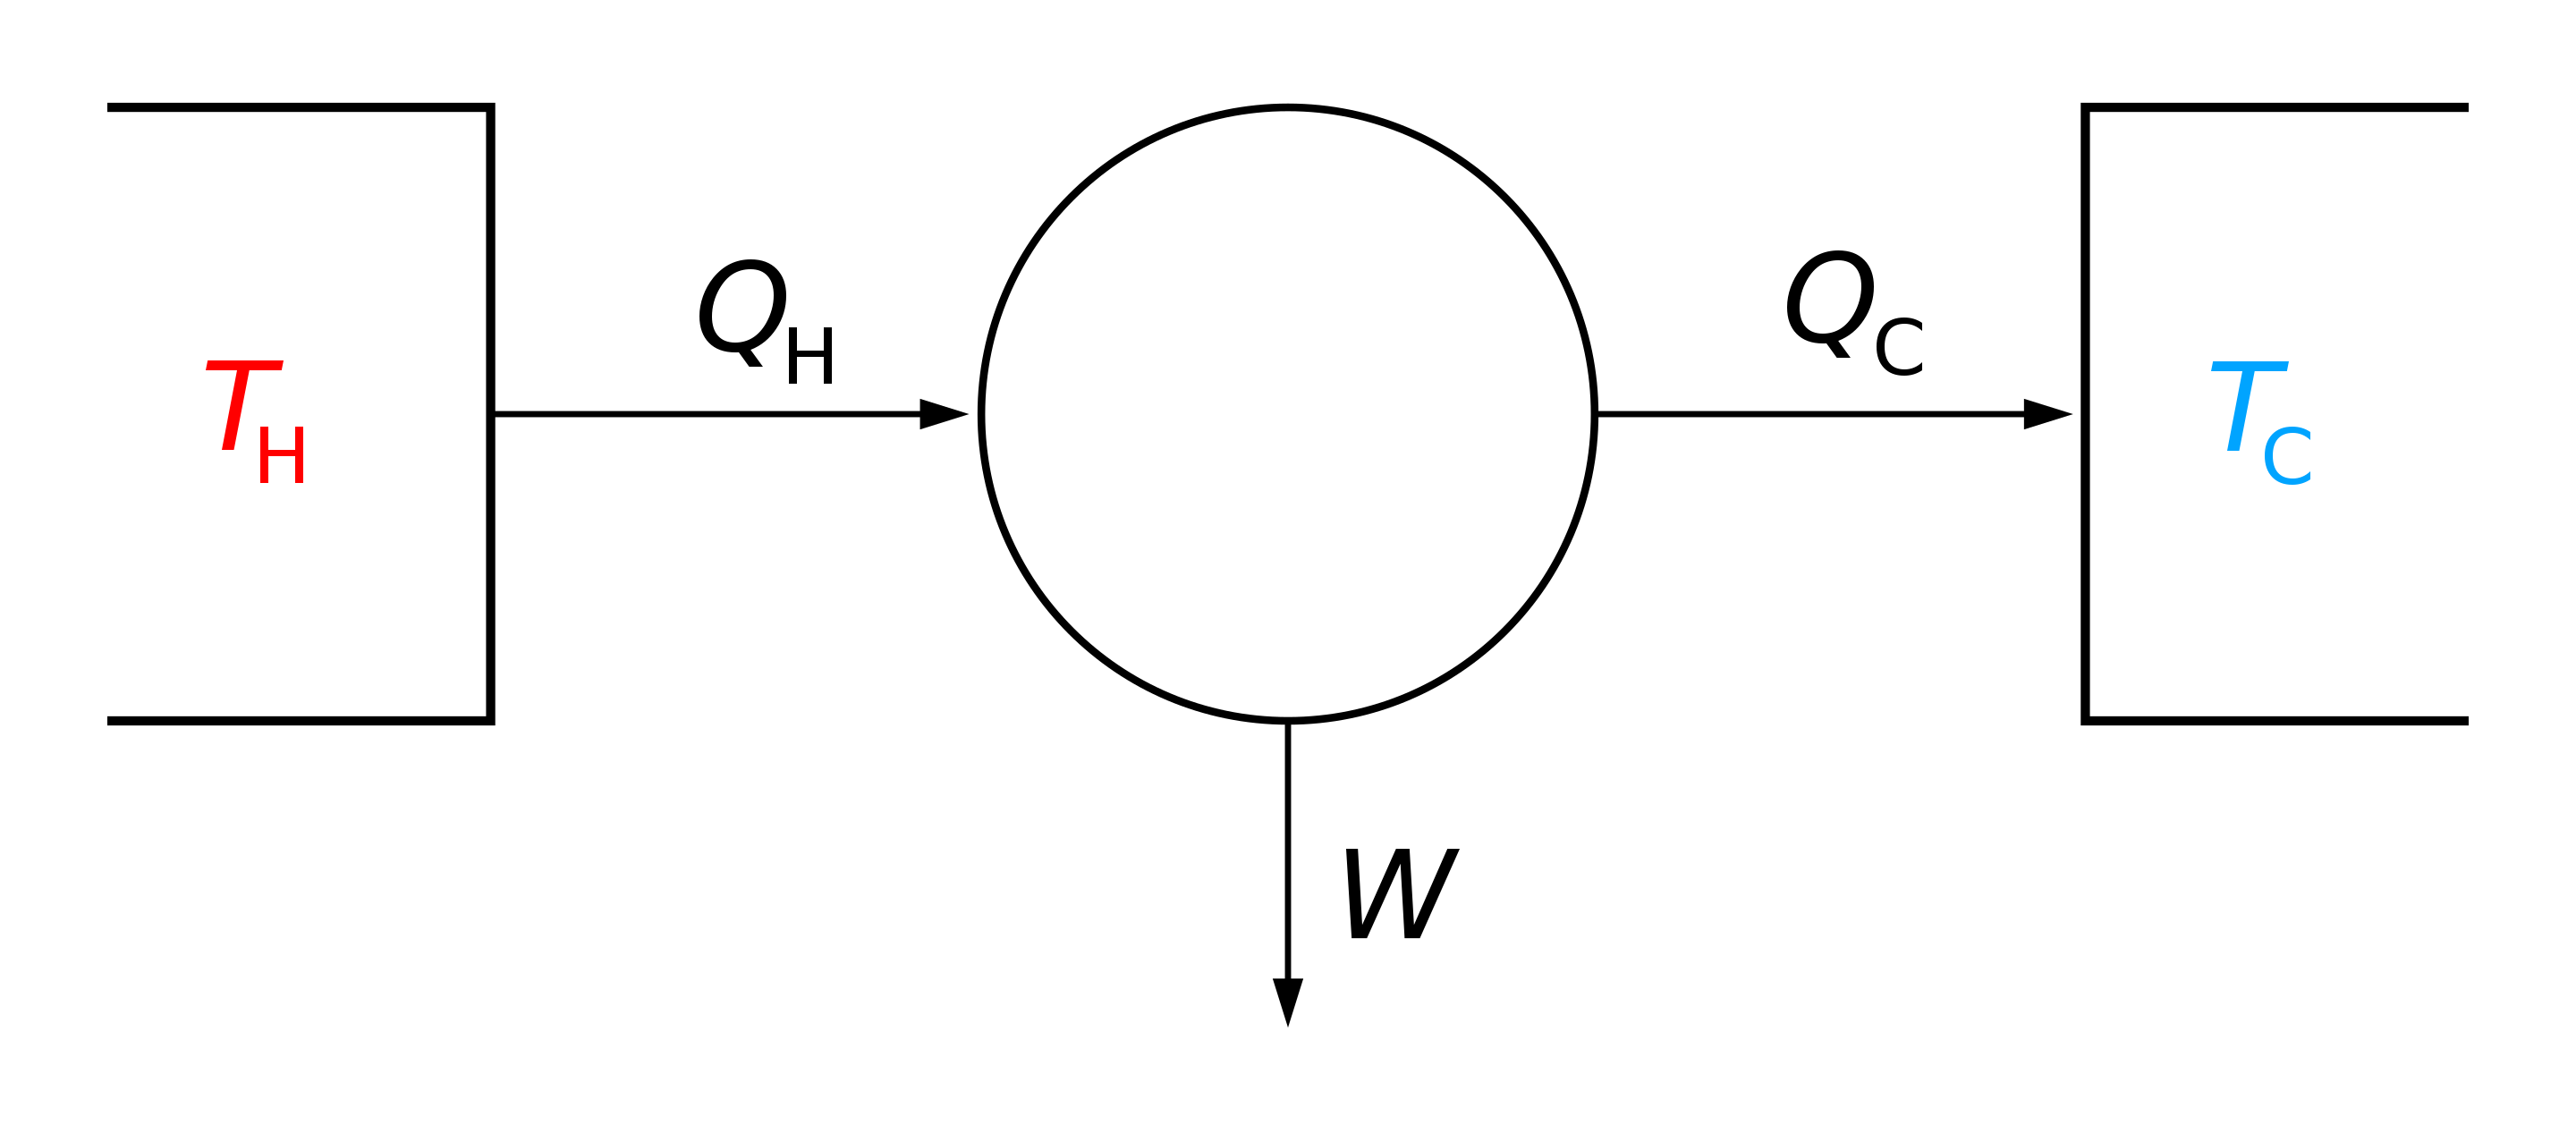
Heat -> Mechanical energy (work)
Source: Wikipedia
Laws of thermodynamics
Zeroth law
“If two systems are each in thermal equilibrium with a third, they are also in thermal equilibrium with each other.”First law
“In a process without transfer of matter, the change in internal energy, \(\Delta U\), of a thermodynamic system is equal to the energy gained as heat, \(Q\), less the thermodynamic work, \(W\), done by the system on its surroundings.”Second law
“Heat does not spontaneously flow from a colder body to a hotter body.”Third law
“As the temperature of a system approaches absolute zero, all processes cease and the entropy of the system approaches a minimum value.”
Read more: Wikipedia
Three efficiencies
- 1st law: actual, thermal efficiency;
\(\eta_1 =\frac{W_{net}}{Q_{in}}=\frac{Q_{high}-Q_{low}}{Q_{high}}=1-\frac{Q_{low}}{Q_{high}}\) - Carnot: maximum possible efficiency;
\(\eta_c =\frac{W_{net}}{Q_{high}}=\frac{T_{high}-T_{low}}{T_{high}}=1-\frac{T_{low}}{T_{high}}\) (Kelvin)
- 2nd law: comparing 1st and Carnot;
\(\eta_2 =\frac{\eta_1}{\eta_c}\)
Read more: Sadi Carnot
A gas turbine engine
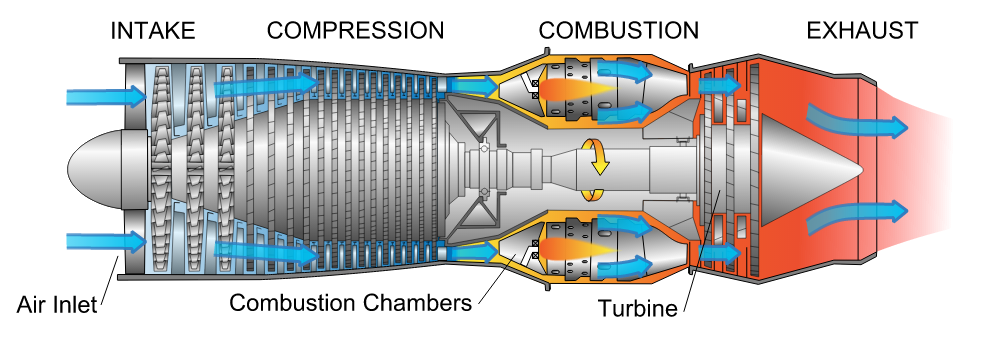
Source: Wikipedia
A steam coal plant
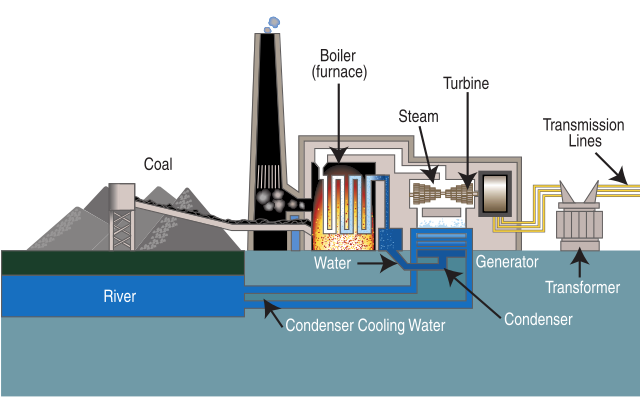
Source: Wikipedia
Brayton cycle vs. Rankine cycle
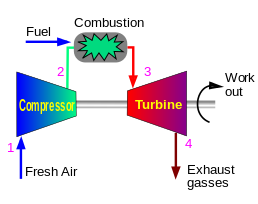
Jet engine, gas turbine
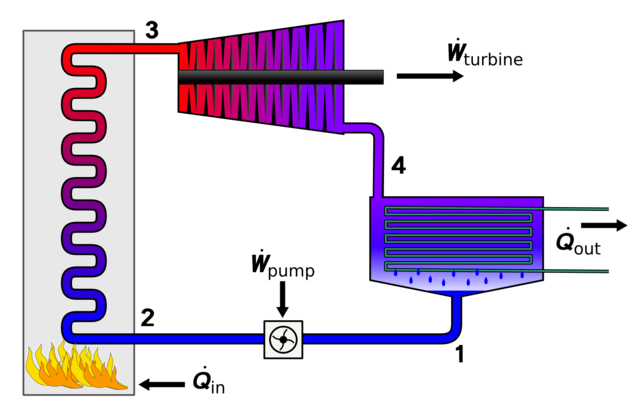
Steam engine, steam turbine
Read more: Wikipedia Brayton cycle and Rankine cycle
Brayton cycle vs. Rankine cycle
| Brayton Cycle | Rankine Cycle |
|---|---|
| Jet, Gas turbine | Steam turbine |
| Open | Open/closed circuits |
| Working fluid in gaseous phase | Working fluid phase change |
Read more: Wikipedia Brayton cycle and Rankine cycle
Largest coal plant in the U.S.
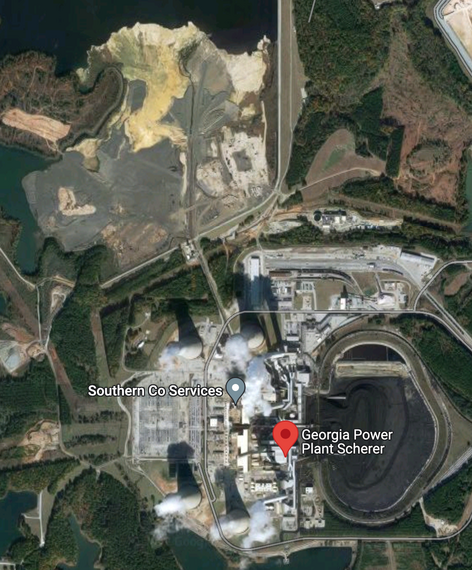
Georgia Power plant Scherer (3,720 MW)
Can you identify the components
- Coal storage
- Generating unit
- Cooling stack
- Bottom ash landfill
- Sub-station
- Transimission lines
- Waste/pollution management
Source: Google Map, read more: Nowhere to hide
Combined cycle
Read more: Tennessee Valley Authority
CCGT diagram
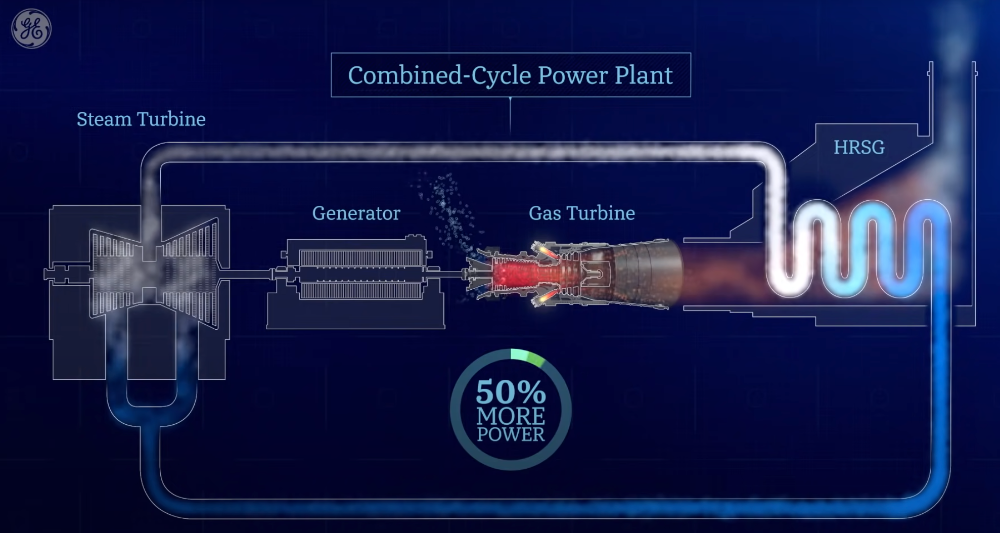
Read more: GE Power
Updating an Rosenfeld Plant?
| 2010 | 2021 | |
|---|---|---|
| Size (MW) | 500 | 940 |
| Capacity Factor | 70% | 43% |
| Generation (TWh/yr) | ~ 3 | ~ 3.6 |
| Emissions (Mt/yr) | ~ 3 | ~ 3.5 |
- NYC electricity use in 2020: ~4 TWh/year
Source: Koomey et al. (2010)
Nuclear
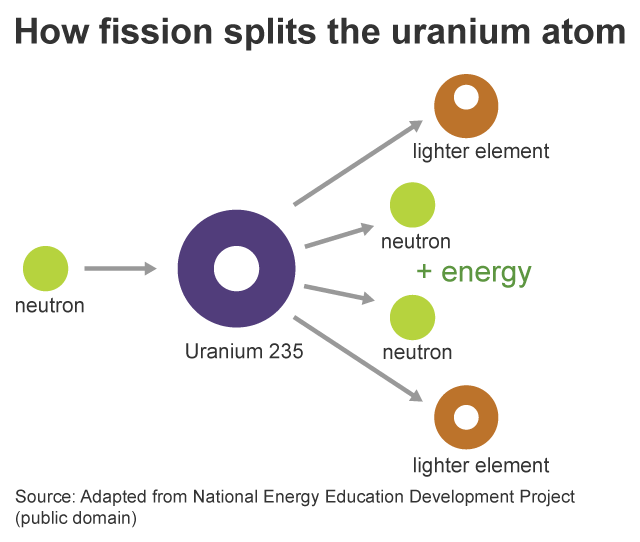
Nuclear fission
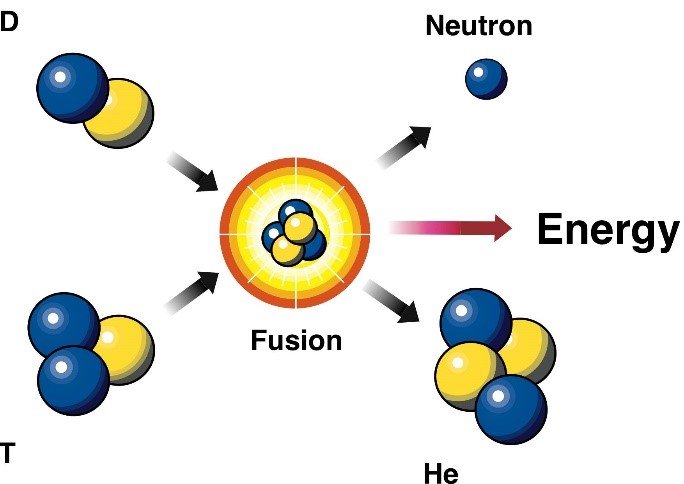
Nuclear fussion
Read more: EIA, Nuclear explained; DOE, Nuclear fusion reactions
Nuclear power plants
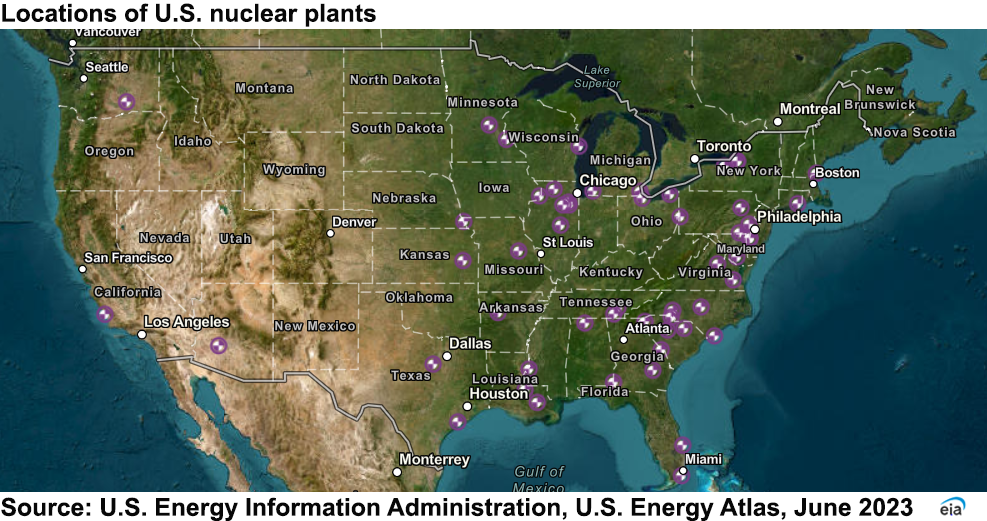
Read more: EIA, Nuclear explained
Nuclear plant design
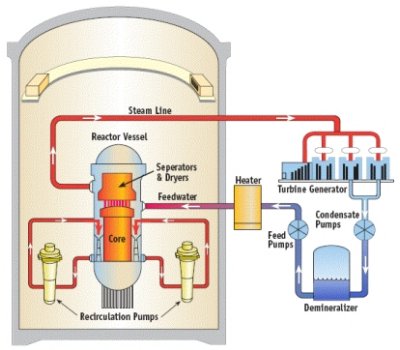
Diagram of a boiling-water nuclear reactor
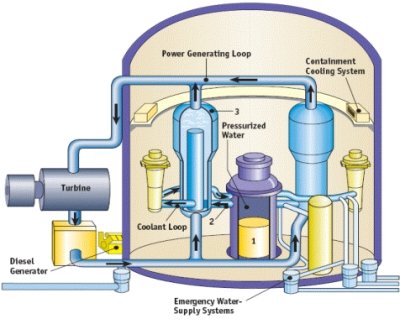
Diagram of a pressurized-water nuclear reactor
Read more: EIA, Nuclear explained
Nuclear fuel cycle
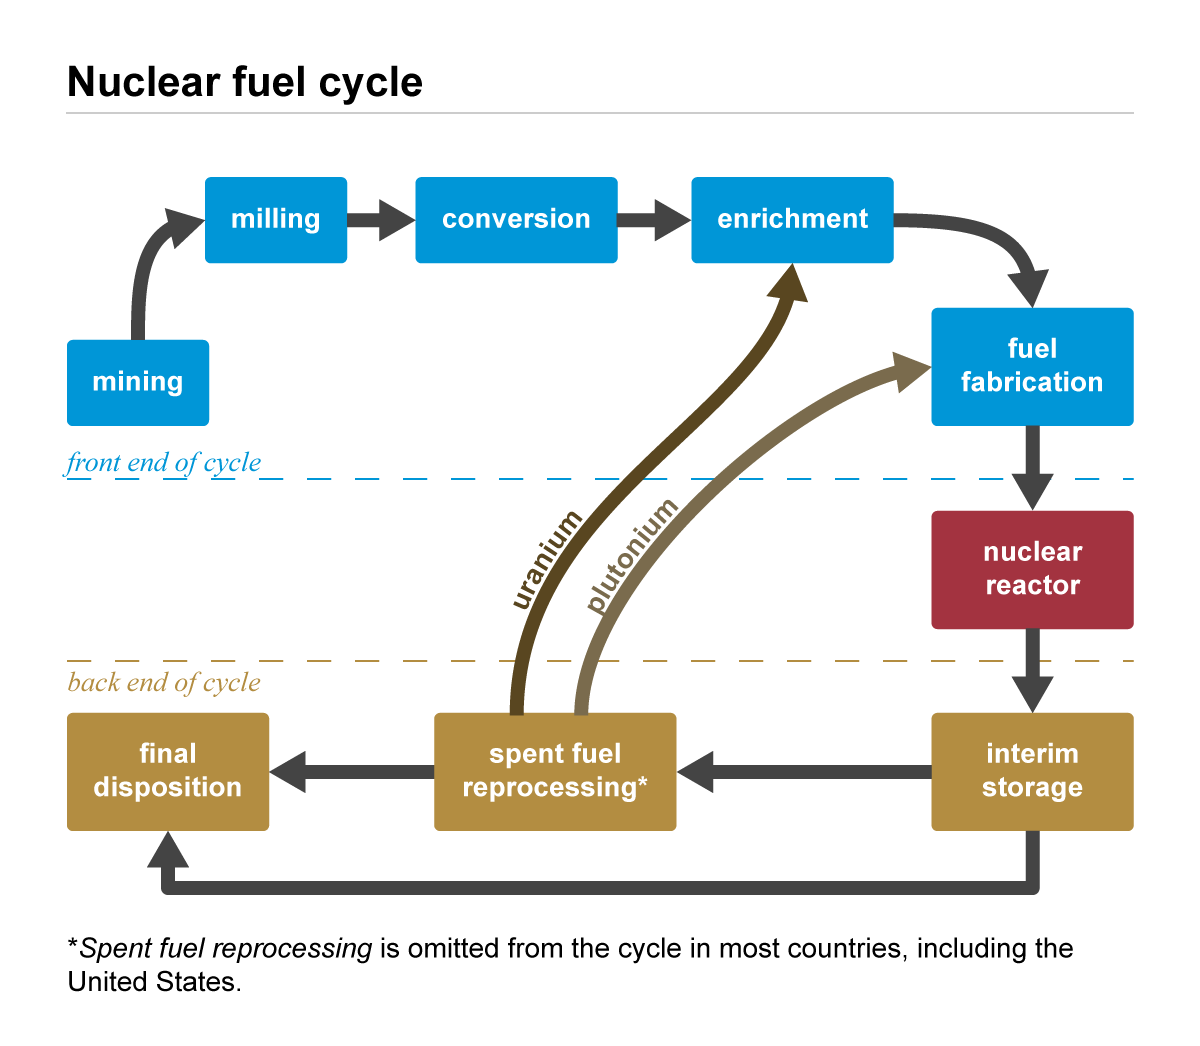
Read more: EIA, Nuclear explained
Next generation of nuclear technology
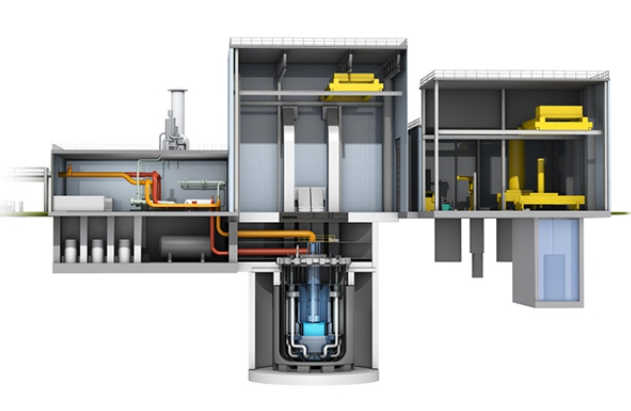
- Modality
- Lower capital costs
- Siting flexibility
- Higher efficiency
- Safe and security
- Industry and manufacture
- Economic
Read more: DOE, Benefits of Small Modular Reactors, TerraPower
Livermore Fusion breakthrough
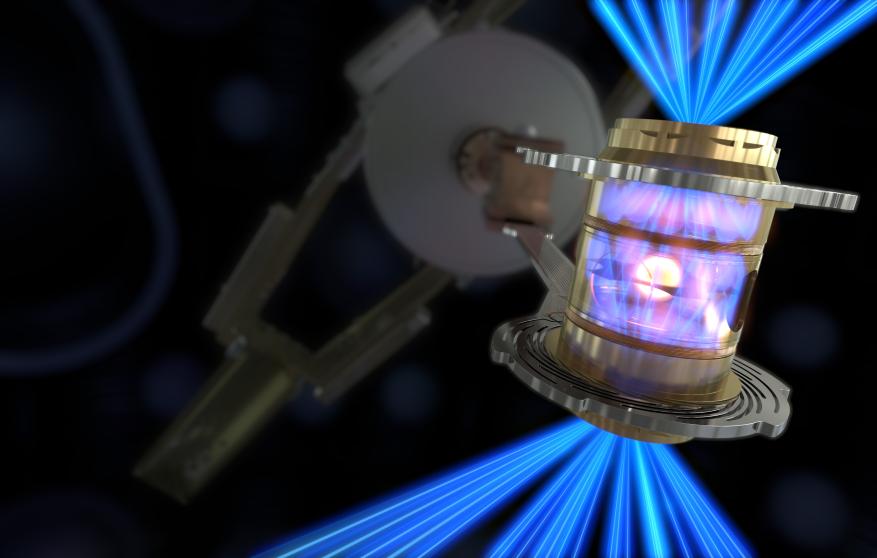
Read more: LLNL
Hydro
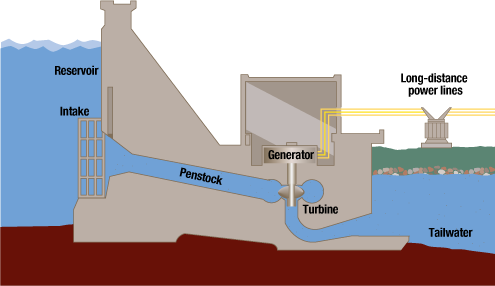
Hydropower
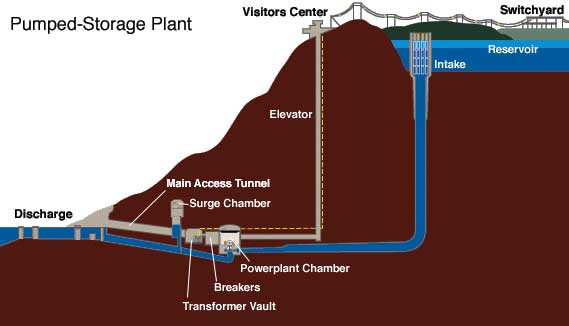
Pumped storage hydropower (PSH)
Source: TVA
How a lithium-ion battery works
Source: Union of Concerned Scientists
Battery management system
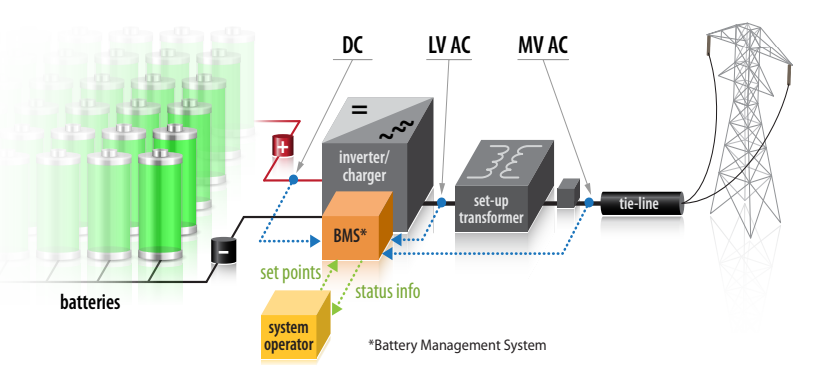
- Rated power capacity
- Energy capacity
- Storage duration
- Cycle life/lifetime
- Self-discharge
- State of charge
- Round-trip efficiency
Read more: NREL, Grid-scale battery storage
Long duration storage
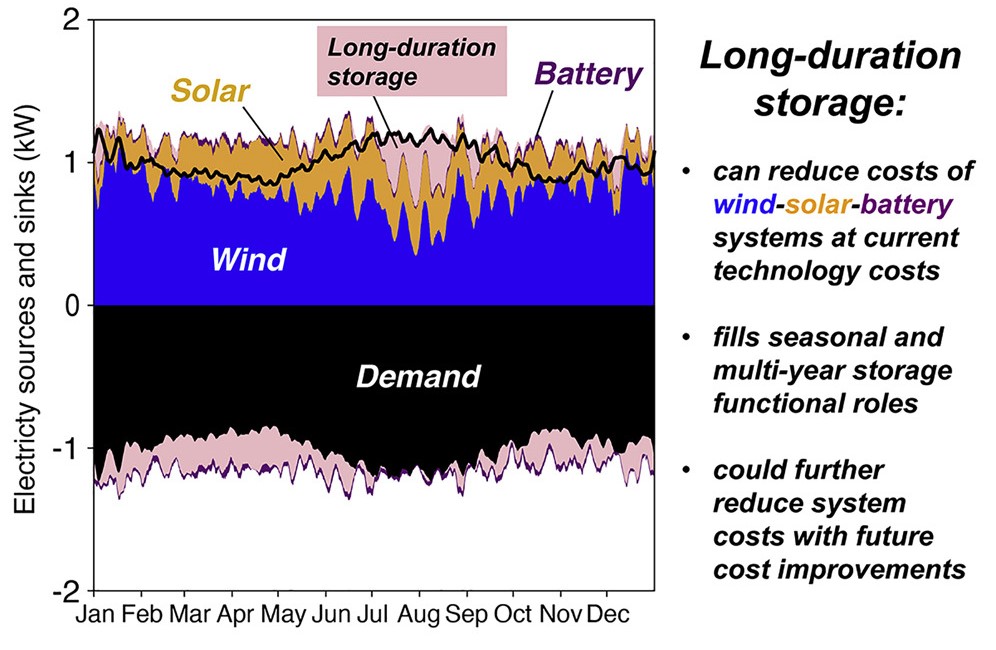
Source: Dowling et al. (2020)
Summary
- Theory - learn and understand the physics of energy technologies:
- thermaldynamics (fossil)
- kinematics (wind)
- light and semiconductor (solar)
- gravity (hydro, tidal)
- atomic (nuclear)
- thermaldynamics (fossil)
- Practice - learn all kinds of corrections based on real-world situation
- The physics doesn’t change, corrections help us to do better jobs in simulation and projections
Social > technology challenges
Photo credit: Gang He; Read more: National Academies