Lecture 10 Data Analysis: Quantitative, Qualitative, and Mixed Analysis
Gang He
November 10, 2026
Recap lecture 9
- Data sources
- Statistical data
- Survey
- Interview
- Evaluation project consultation
- Case: AI and Big Data for Program Evaluation
Today’s agenda
- Data analysis
- Qualitative methods
- Quantitative methods
- Visualization
- Story telling
- Case: CUNY SEEK Program
Qualitative data
| Primary purpose | Methods |
|---|---|
| Enumerative | Classical Content Analysis; Word count; Cultural domain analysis; Ethnographic decision models |
| Descriptive | Matrix displays; Timelines; Concept maps/mind maps; Template/framework analysis |
| Hermeneutic | Thematic analysis; Constant comparative method; Thematic narrative analysis; Framework analysis; Discourse analysis; Qualitative content analysis |
| Explanatory | Qualitative comparative analysis; Process tracing |
Source: Newcomer et al. (2015)
Coding and categorizing

Source: Dodds et al. (2011)
Coding: From Interview to Theme
Example: Evaluating a Job Training Program
| Interview Response | Initial Code | Theme |
|---|---|---|
| “The training center was too far away.” | Transportation | Access barriers |
| “I couldn’t attend because of childcare.” | Childcare | Access barriers |
| “My instructor helped me prepare for interviews.” | Instructor support | Program support |
| “I found a job through the program.” | Employer connections | Program support |
Three Steps of Thematic Analysis
- Coding: Assign labels to meaningful text segments.
- Categorizing: Group related codes into broader concepts.
- Theming: Identify patterns that help explain experiences.
Qualitative analysis is systematic interpretation, not simply collecting quotes.
Matrix displays
I have two kinds of problems: the urgent and the important. The urgent are not important, and the important are never urgent.
— Dwight D. Eisenhower
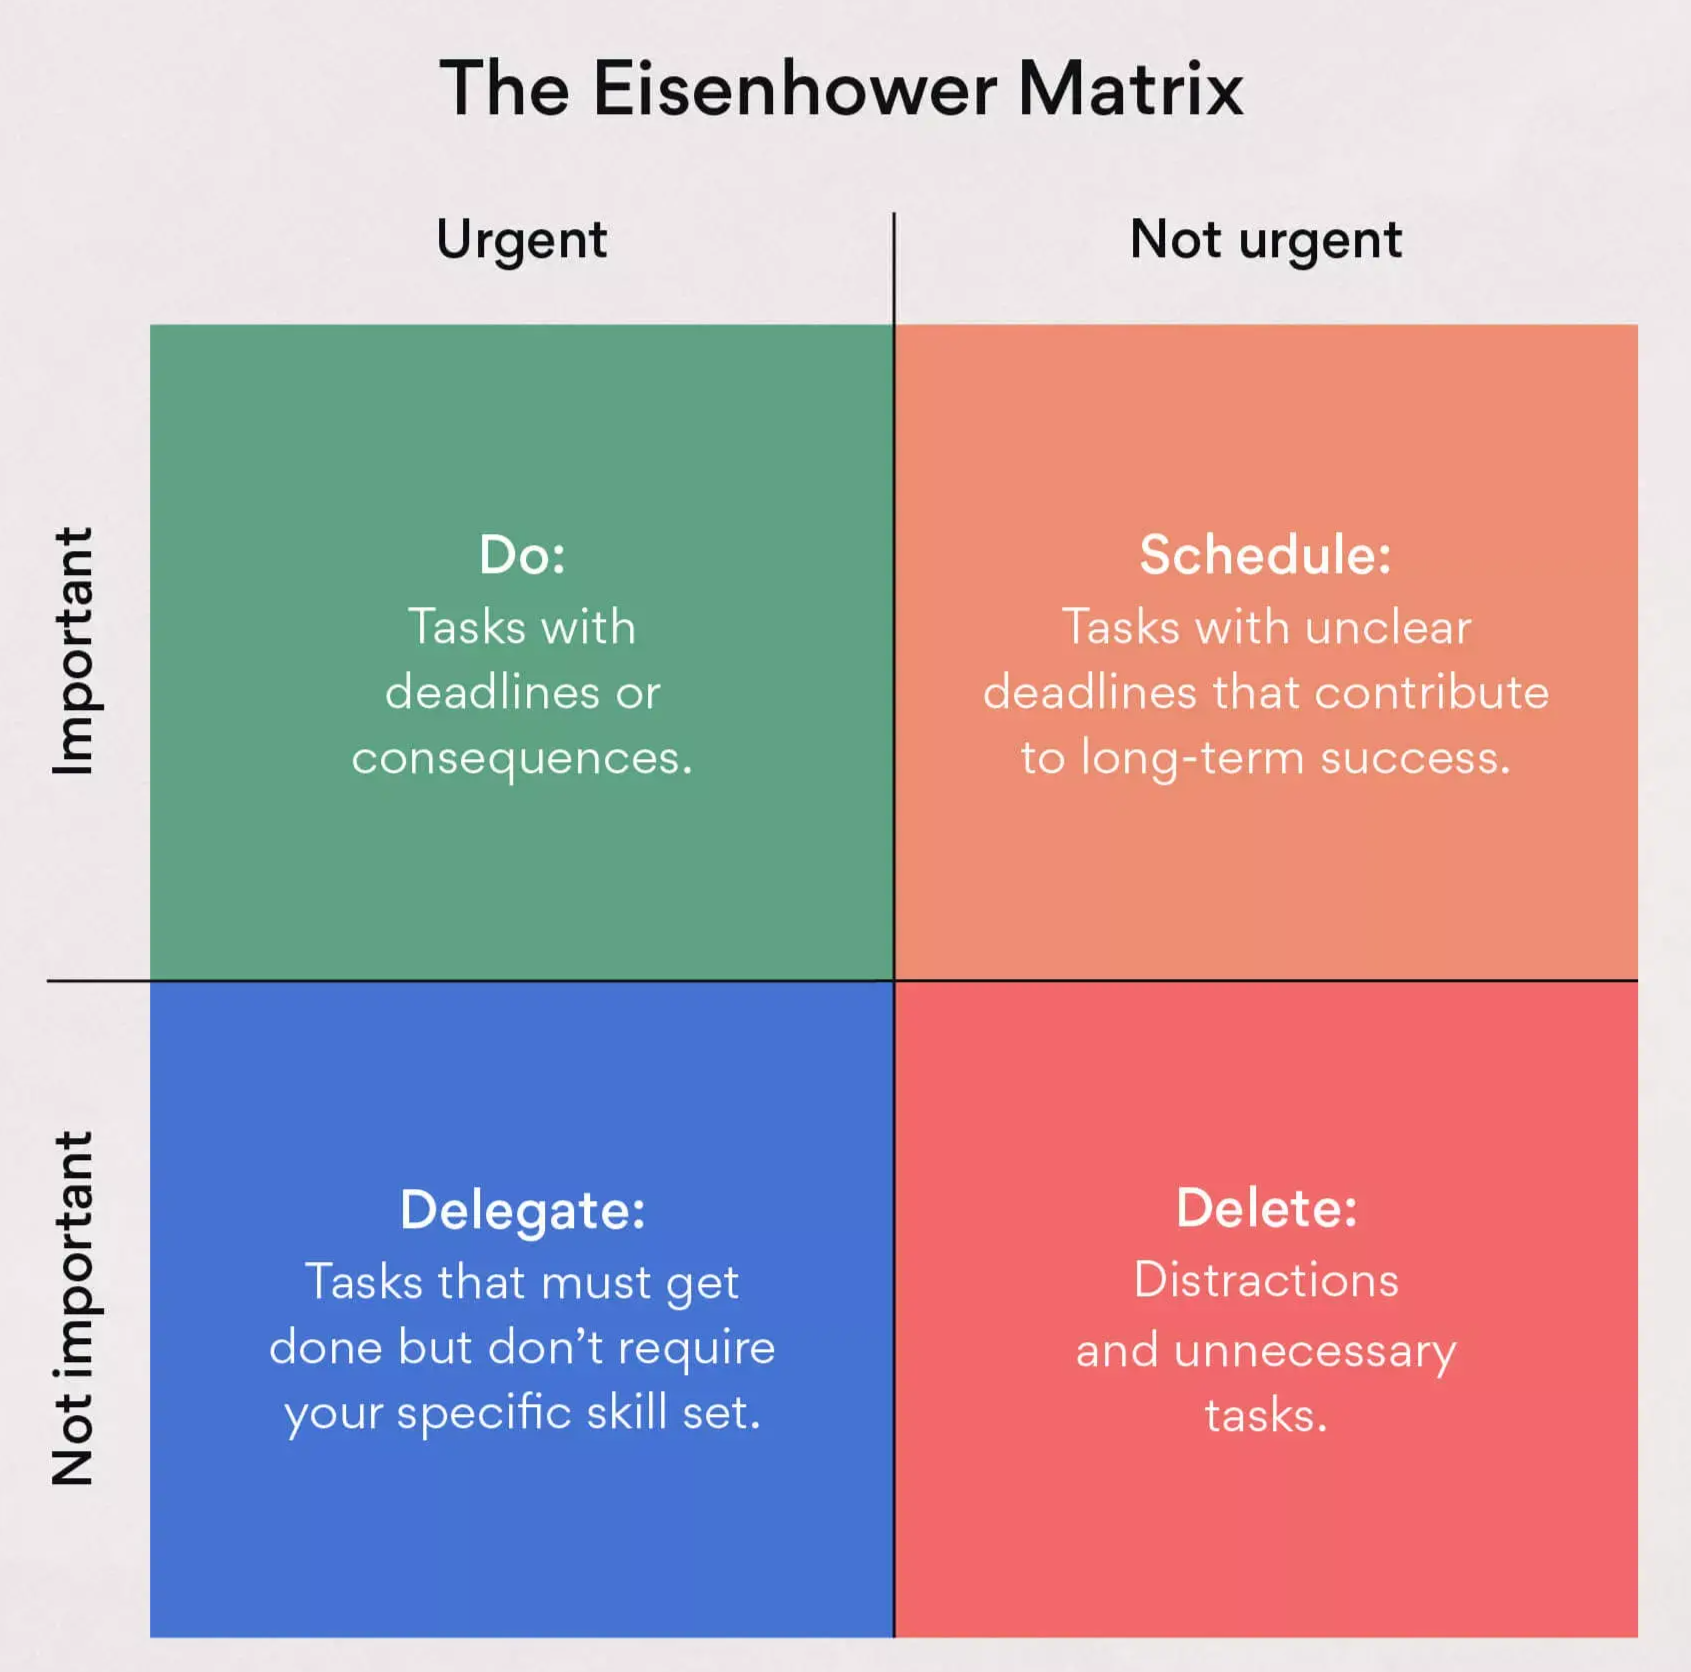
Image source
Delphi method/technique

Source: Image created by Bing with DALL-E 3
Word counting
- 2,406: Number of words in President Obama’s inaugural speech
- 4: Number of times the president said “crisis”
- 3: Number of times he said “economy”
- 2: Number of times he said “war”
- 67: Number of times he said “our”
- 2: Number of times he said “my”
- 1: Number of times he said “change”
- 11: Number of times he said “new”
Discuss the limitations of word counting
Source: U.S. News
Mindmap

Open source options: Markmap
Descriptive statistics
- Distribution
- Measures of central tendency
- Mean
- Median
- Mode
- Measures of variability
- Range
- Standard deviation
- Variance
- Interquartile range
Statistical tests

Source: Scribbr; Learn more: Data Analysis and Statistics with R, R for Data Science
R squared
“The proportion of the variation in the dependent variable that is predictable from the independent variable(s).”
\(R^2\) does not indicate whether:
- the independent variables are a cause of the changes in the dependent variable;
- omitted-variable bias exists;
- the correct regression was used;
- the most appropriate set of independent variables has been chosen;
- there is collinearity present in the data on the explanatory variables;
- the model might be improved by using transformed versions of the existing set of independent variables;
- there are enough data points to make a solid conclusion.
Source: Wikipedia
Summary of statistics
| United States | China | Germany | |
|---|---|---|---|
| Est. (Std. Err.) | Est. (Std. Err.) | Est. (Std. Err.) | |
| (Intercept) | 15 (1.04)*** | 18 (1.58)*** | 12 (0.96)*** |
| log(cum_capacity_kw) | -0.44 (0.045)*** | -0.57 (0.070)*** | -0.33 (0.042)*** |
| log(price_si) | 0.15 (0.058)* | 0.23 (0.079) | 0.21 (0.054) |
Asterisks indicate the level of significance: *5%; **1%; ***0.1%.
Source: Helveston et al. (2022)
Statiscal significance
p value: “The lower the p-value is, the lower the probability of getting that result if the null hypothesis were true.”

Statistical vs. Practical Significance
Example: Evaluating Two Job Training Programs
| Indicator | Program A | Program B |
|---|---|---|
| Estimated employment impact | +1 percentage point | +10 percentage points |
| p-value | 0.001 | 0.08 |
| Significant at 5%? | Yes | No |
| Estimated impact per 1,000 participants | 10 additional employed | 100 additional employed |
How Should Policymakers Decide?
- Statistical significance: How strong is the evidence against the null hypothesis?
- Practical significance: Is the estimated effect large enough to matter?
- Uncertainty: What effects are compatible with the confidence interval?
- Cost-effectiveness: Are the expected benefits worth the program costs?
A statistically significant effect is not necessarily a meaningful policy impact.
Stories
- Data story
- Method story
- Pattens and trends
- Organization and instution vision, mission, and efforts
- Motivate changes
Climate Strips

Duck curve

Source: EIA
Good Data Visualization?
Five Principles
- Clear message: What should the audience learn?
- Appropriate chart: Match the visualization to the data.
- Honest scales: Avoid misleading axes and proportions.
- Useful comparisons: Show trends, differences, or benchmarks.
- Context and uncertainty: Include units, sources, and limitations.
Choosing the Right Chart
| Evaluation Question | Recommended Chart |
|---|---|
| Did outcomes change over time? | Line chart |
| How do program groups compare? | Bar chart |
| What is the distribution of outcomes? | Histogram or box plot |
| What is the estimated program impact? | Coefficient plot with confidence intervals |
Why are the climate stripes and duck curve so memorable?
Good visualization communicates evidence clearly without distorting it.
References
Benjamin, Daniel J., James O. Berger, Magnus Johannesson, et al. 2018. “Redefine Statistical Significance.” Nature Human Behaviour 2 (1): 6–10. https://doi.org/10.1038/s41562-017-0189-z.
Dodds, Peter Sheridan, Kameron Decker Harris, Isabel M. Kloumann, Catherine A. Bliss, and Christopher M. Danforth. 2011. “Temporal Patterns of Happiness and Information in a Global Social Network: Hedonometrics and Twitter.” PLOS ONE 6 (12): e26752. https://doi.org/10.1371/journal.pone.0026752.
Helveston, John Paul, Gang He, and Michael R. Davidson. 2022. “Quantifying the Cost Savings of Global Solar Photovoltaic Supply Chains.” Nature 612 (7938): 83–87. https://doi.org/10.1038/s41586-022-05316-6.
Leek, Jeff, Blakeley B. McShane, Andrew Gelman, David Colquhoun, Michèle B. Nuijten, and Steven N. Goodman. 2017. “Five Ways to Fix Statistics.” Nature 551 (7682): 557–59. https://doi.org/10.1038/d41586-017-07522-z.
Newcomer, Kathryn E., Harry P. Hatry, and Joseph S. Wholey. 2015. Handbook of Practical Program Evaluation. 4th edition. Jossey-Bass.